LWC Performance is about making components load fast, respond instantly and stay smooth even with large data. Users notice a slow page within a second, and on a busy record page every component adds up. Most speed problems come from a few habits: too many server calls, too much data, and too much rendering.
In this post, you will learn how to measure speed, cache data, reduce server calls, render less, debounce input and page through large lists. It builds on calling Apex from LWC, LWC loops and LWC Jest testing.
What is LWC Performance?
LWC Performance is how quickly a component gets its data, renders it and reacts to the user. It depends on three things: the number and size of server calls, the amount of DOM the browser must build, and the JavaScript that runs on each render. Improving any of the three makes the page faster.
Think of a busy restaurant kitchen. Speed does not come from cooks running faster. It comes from preparing common dishes in advance, cooking only what is ordered, and not plating ten courses before the guest asks. Caching, lazy rendering and paging are those kitchen habits.
Why LWC Performance Matters
Slow components hurt every user, every day. Here is why LWC Performance matters at Bright Path Tutors.
- First, tutors open course records dozens of times a day.
- Also, the catalog may hold thousands of courses.
- Next, a search box that calls Apex on every key press feels laggy.
- Mobile users have slower networks and devices.
- Finally, one slow component delays the whole page.
So small LWC Performance changes in each component add up to a much faster org.
How to Improve LWC Performance
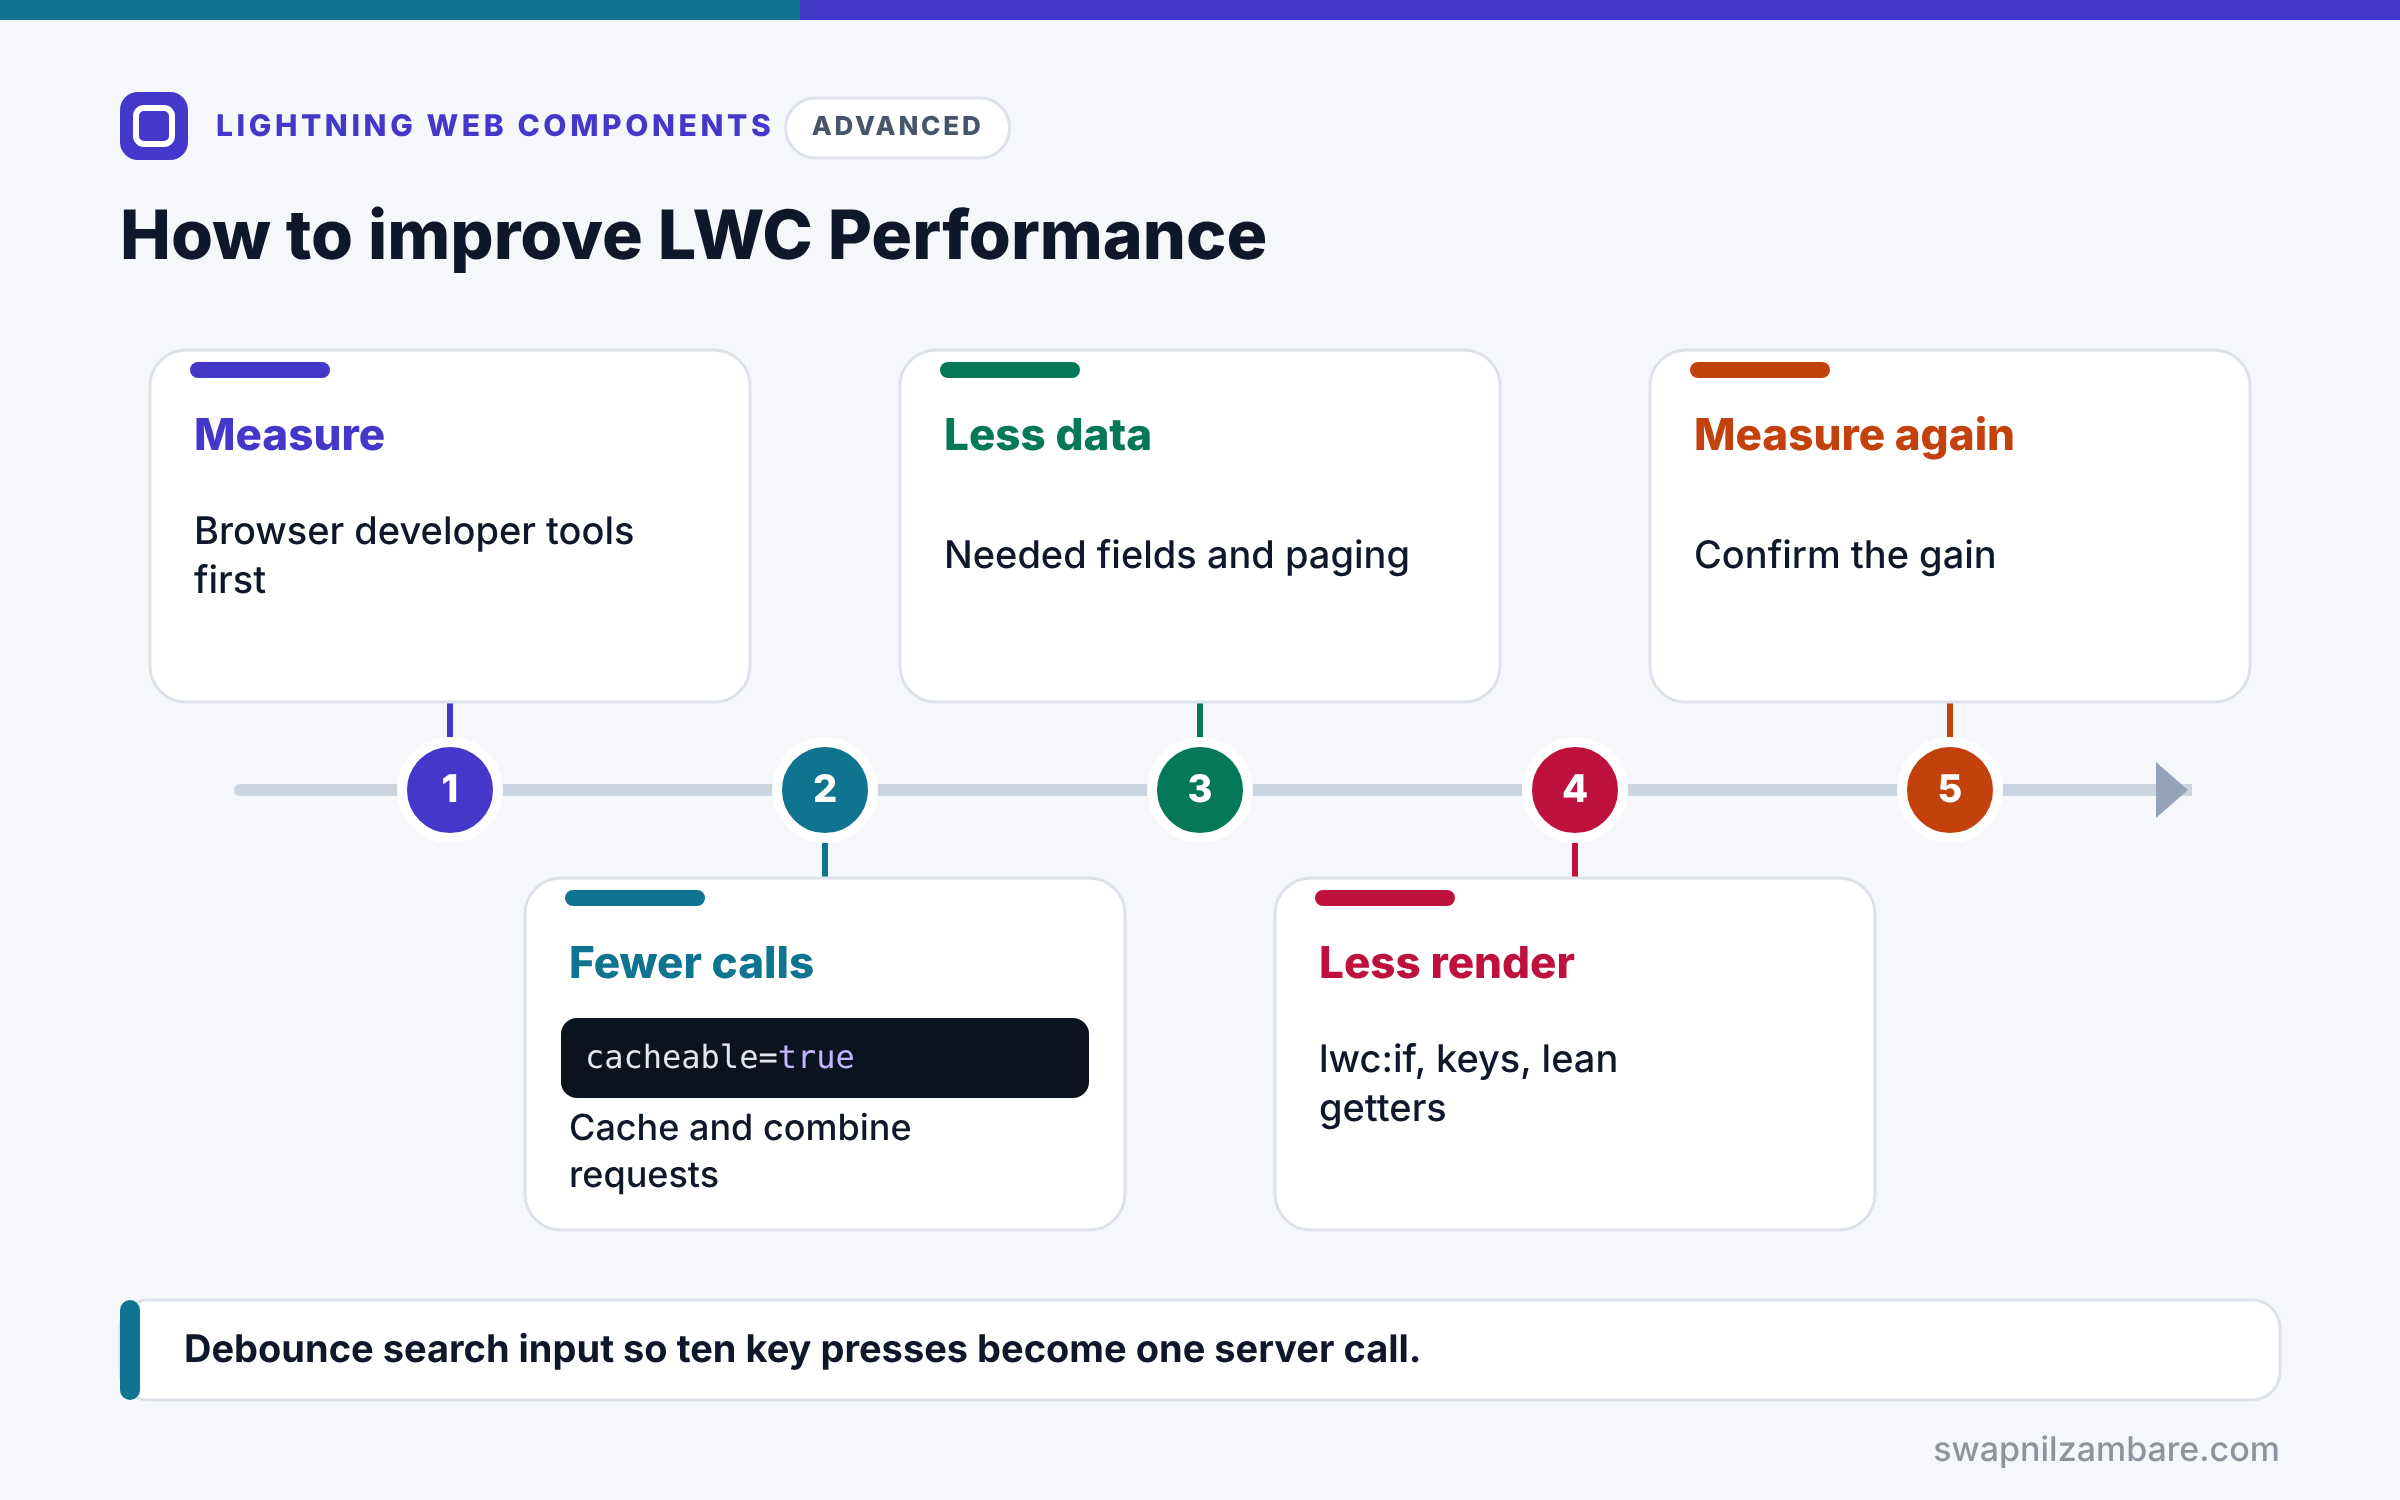
LWC Performance work follows a simple order. First, measure with browser developer tools to find the slow part. Next, reduce server calls by caching and by combining requests. Then reduce data by asking only for needed fields and paging large lists. After that, reduce rendering with lwc:if, keys and lean getters. Finally, measure again to confirm the gain.
Measure First
Use the browser’s developer tools to see network calls and rendering time. Also, keep debug mode off for normal users, because it makes Lightning slower.
Cache Data
Lightning Data Service and wire adapters share a cache. For Apex, mark read methods cacheable=true, so repeated calls can come from the cache.
Ask for Less Data
Query only the fields the component shows, and use LIMIT. Smaller results travel and render faster.
Render Less
lwc:if skips rendering hidden blocks entirely. So put tabs, details and rare sections behind lwc:if instead of hiding them with CSS.
Debounce Input
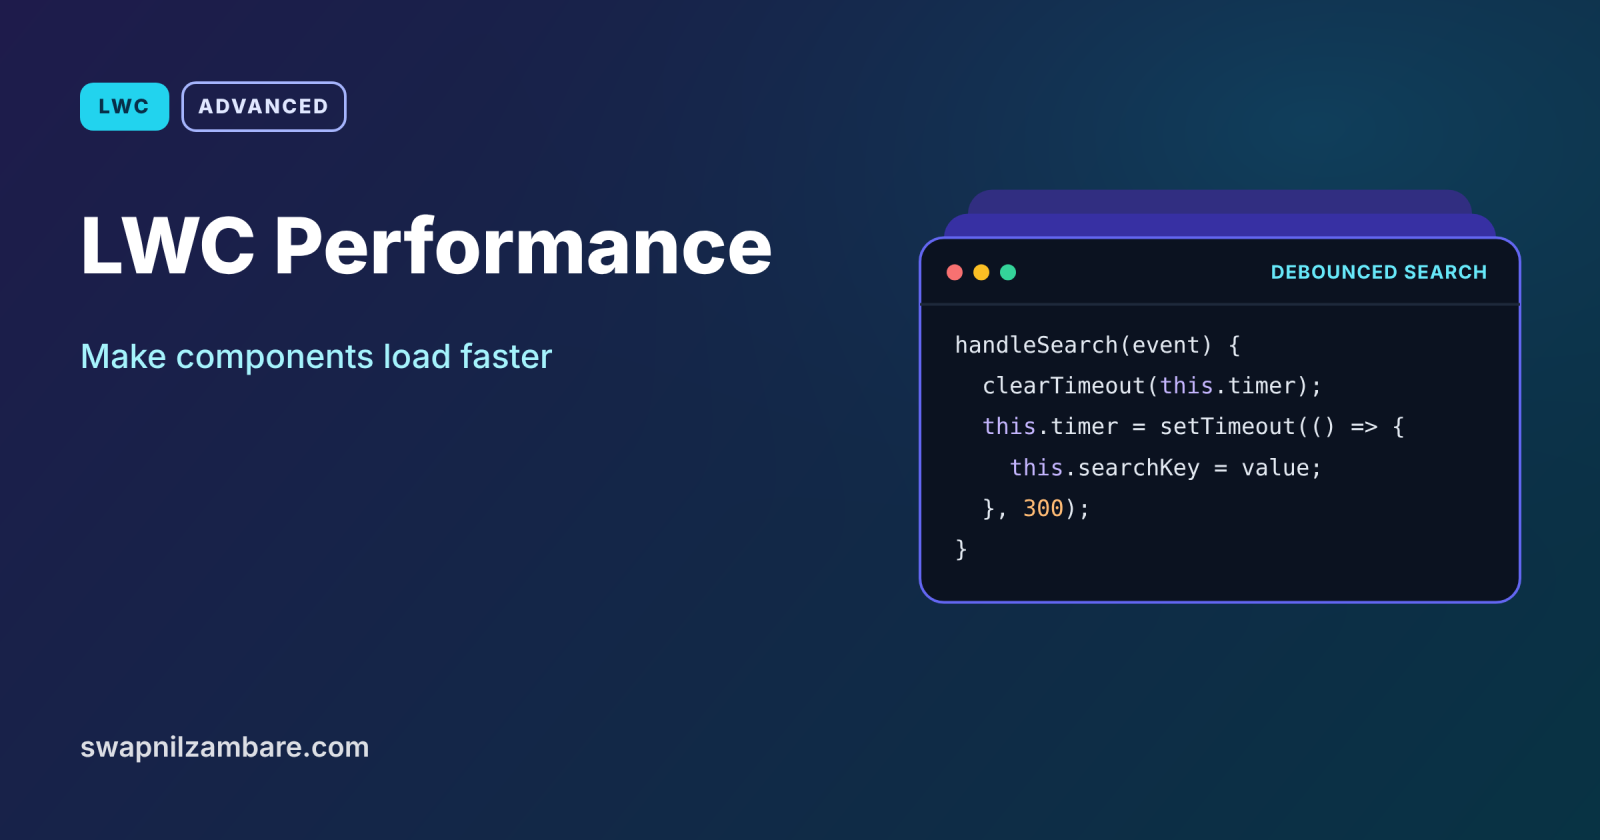
Wait until the user stops typing, for example 300 milliseconds, before searching. This turns ten server calls into one.
Page Large Lists
Show 20 to 50 rows at a time, with Load more or infinite loading in lightning-datatable. Browsers struggle with thousands of DOM rows.
Keep Getters and renderedCallback Lean
Getters and renderedCallback run often. So keep heavy loops out of them, and compute values once when data arrives.
Quick Wins for LWC Performance
The table below lists common fixes and their effect.
| Fix | Effect |
|---|---|
| cacheable=true on read methods | Fewer server calls |
| Only needed fields in SOQL | Smaller responses |
| lwc:if for hidden sections | Less DOM to build |
| Debounced search | Far fewer calls while typing |
| Paging or infinite loading | Fast lists of any size |
| Record Id as loop key | Efficient list updates |
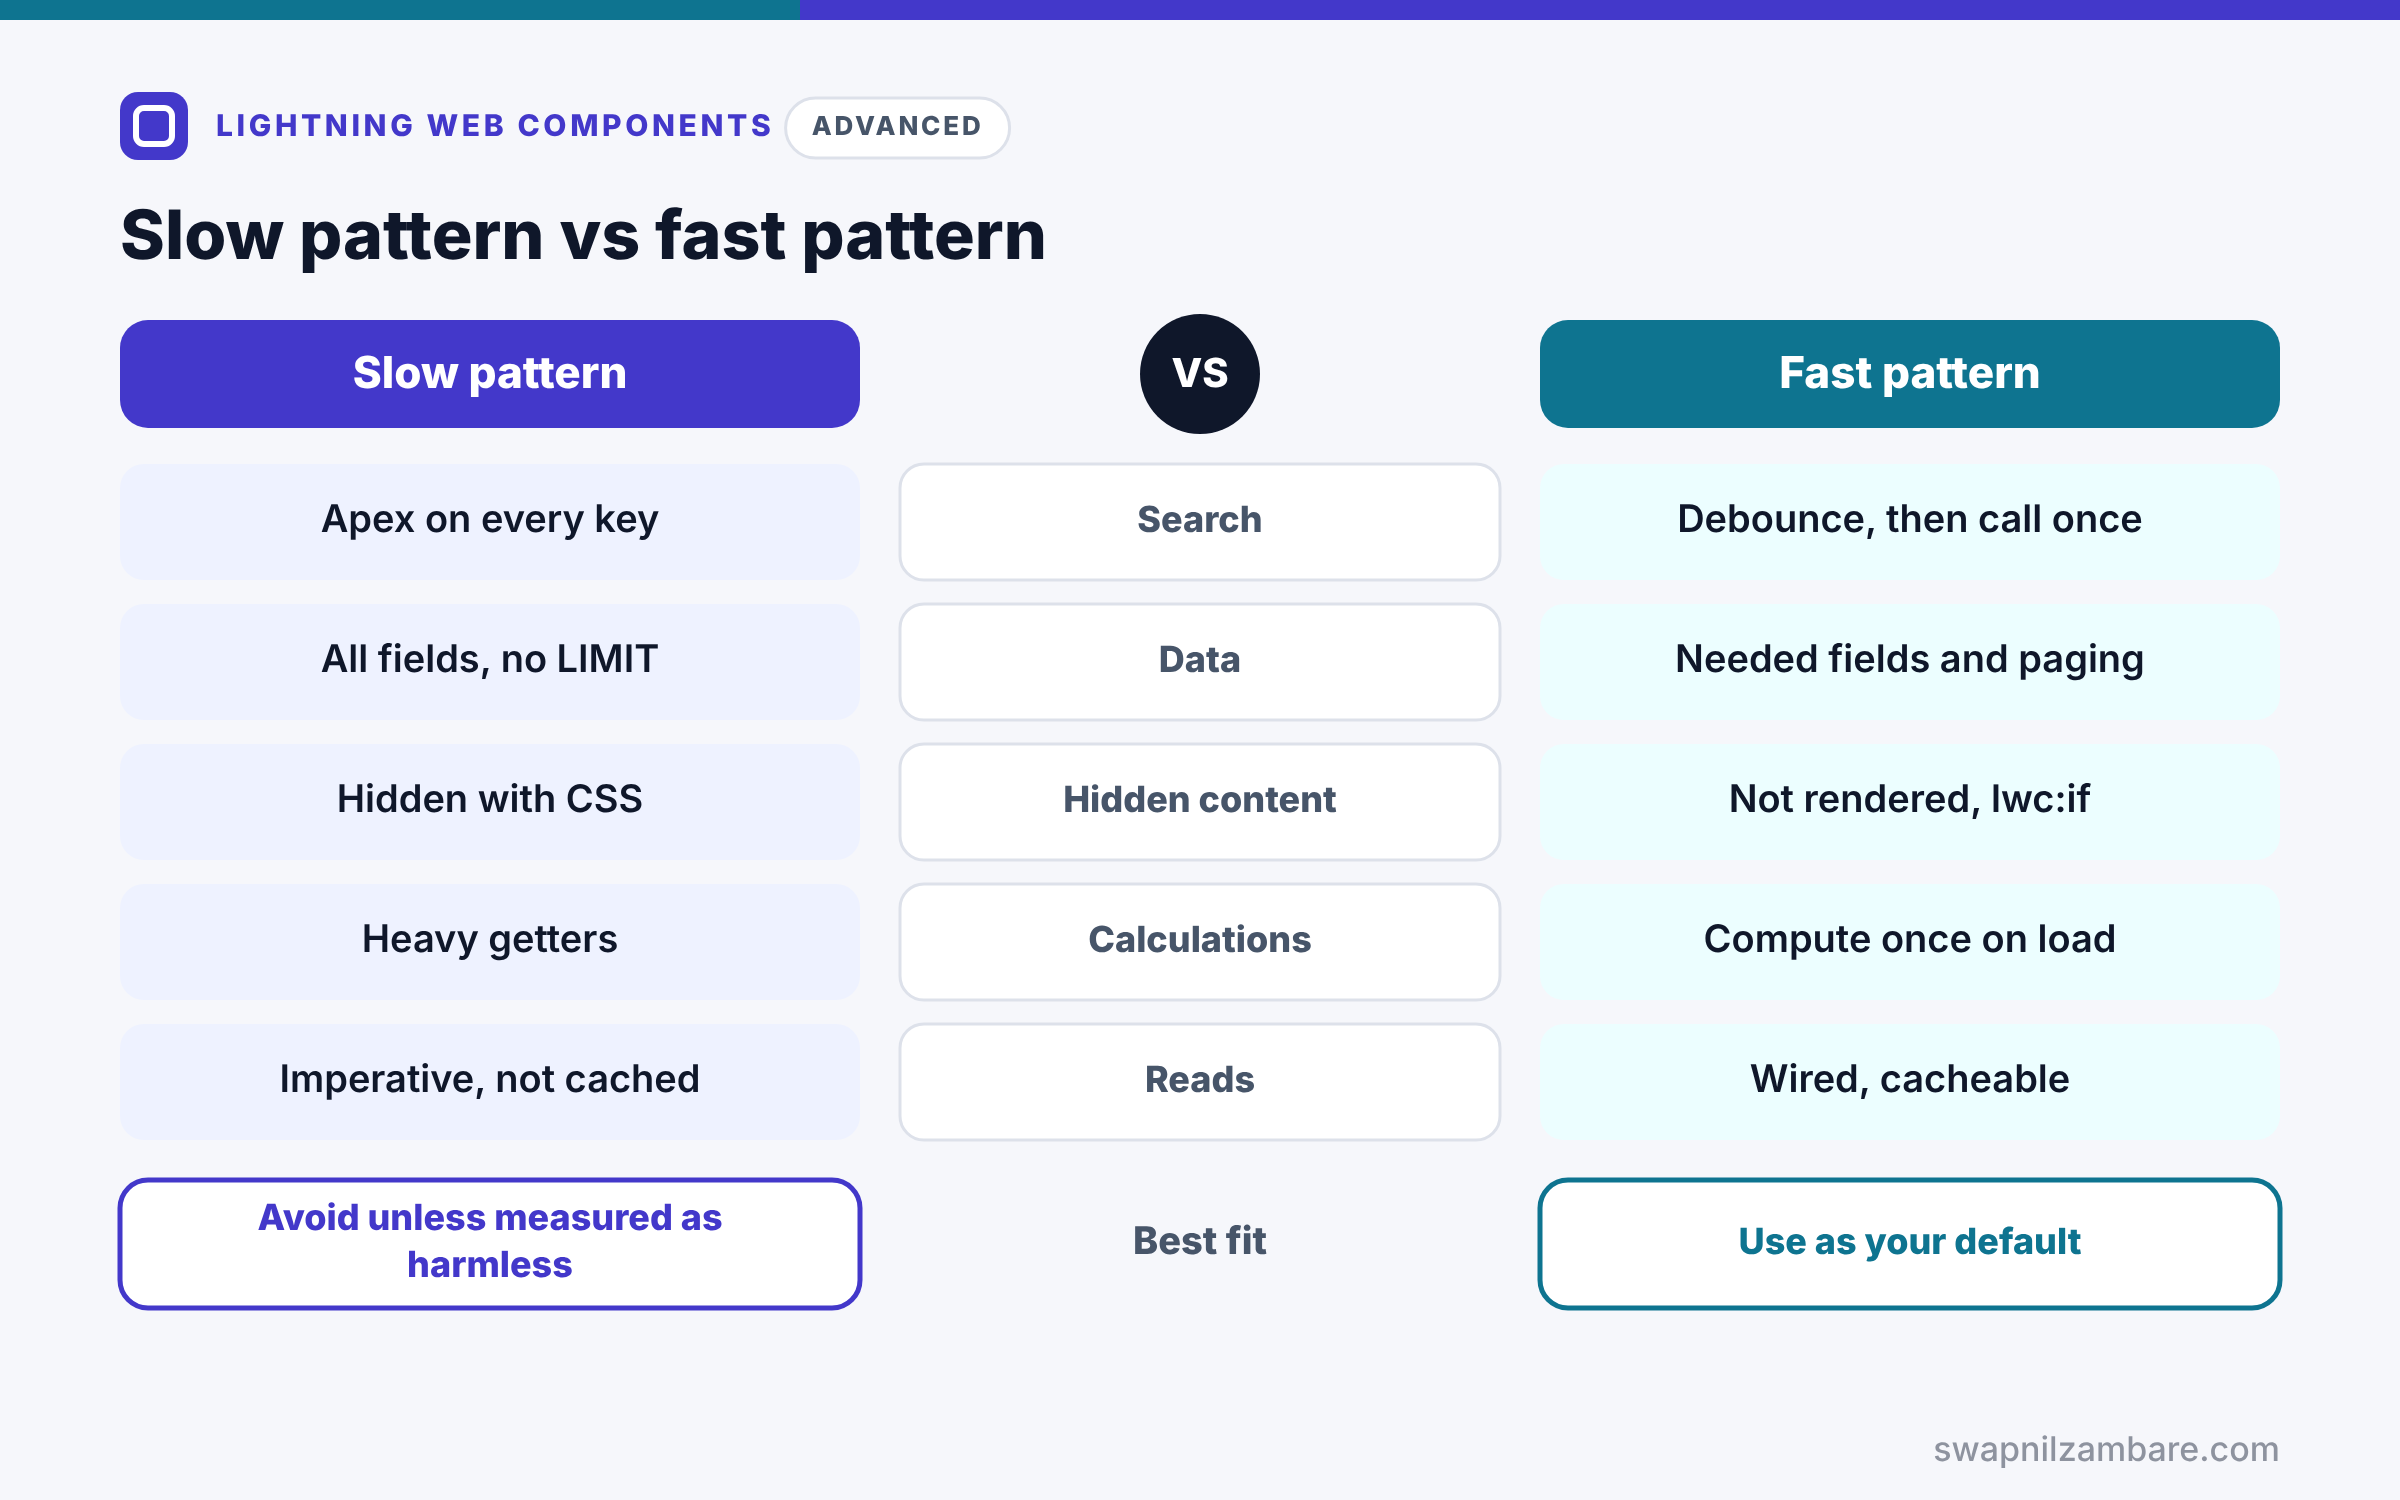
Slow Pattern vs Fast Pattern
The table below compares typical slow and fast choices.
| Feature | Slow pattern | Fast pattern |
|---|---|---|
| Search | Call Apex on every key | Debounce, then call once |
| Data | SELECT all fields, no LIMIT | Needed fields, LIMIT and paging |
| Hidden content | Hidden with CSS | Not rendered with lwc:if |
| Calculations | Heavy getters | Compute once on data load |
| Reads | Imperative, not cached | Wired, cacheable |
When to use which is clear. Always start with the fast patterns. Use the slow patterns only when you have measured that they do not matter.
A Real LWC Performance Example
Let’s improve LWC Performance in the course search at Bright Path Tutors. The old version called Apex on every key press and loaded every course.
Step 1: A Paged, Cacheable Apex Method
public with sharing class CourseController {

    @AuraEnabled(cacheable=true)
    public static List<Course__c> searchCoursesPage(String searchKey, Integer pageSize, Integer offsetRows) {
        String pattern = '%' + (searchKey == null ? '' : searchKey) + '%';
        return [SELECT Id, Name, Fee__c
                FROM Course__c
                WHERE Name LIKE :pattern
                WITH USER_MODE
                ORDER BY Name
                LIMIT :pageSize OFFSET :offsetRows];
    }
}
The method returns only three fields and one page of rows. Because it is cacheable, LWC can reuse results for the same search and page.
Step 2: Debounced Search and Load More
import { LightningElement, wire } from 'lwc';
import searchCoursesPage from '@salesforce/apex/CourseController.searchCoursesPage';

const PAGE_SIZE = 20;

export default class FastCourseSearch extends LightningElement {
    searchKey = '';
    offsetRows = 0;
    courses = [];
    timer;

    @wire(searchCoursesPage, { searchKey: '$searchKey', pageSize: PAGE_SIZE, offsetRows: '$offsetRows' })
    wiredPage({ data }) {
        if (data) {
            this.courses = this.offsetRows === 0 ? data : [...this.courses, ...data];
        }
    }

    handleSearch(event) {
        const value = event.target.value;
        clearTimeout(this.timer);
        this.timer = setTimeout(() => {      // wait until typing pauses
            this.offsetRows = 0;
            this.searchKey = value;
        }, 300);
    }

    handleLoadMore() {
        this.offsetRows += PAGE_SIZE;
    }
}
handleSearch waits 300 milliseconds after the last key before changing searchKey, so the wire runs once per pause. Then handleLoadMore moves the offset, and the wire adds the next 20 rows to the list.
Step 3: Compare the Results
Here is a typical before and after for a catalog of 3,000 courses, using example figures.
Before: 4 Apex calls, 3,000 rows rendered, about 2.8 s until usable
After:  1 Apex call, 20 rows rendered, about 0.4 s until usable
The component now feels instant, and Load more fetches extra rows only when needed. Your own numbers will differ, so always measure in your org.
LWC Performance and OFFSET Limits
SOQL OFFSET works up to 2,000 rows. For deeper lists, page with a filter such as Name > :lastName instead, as shown in our SOQL WHERE, ORDER BY and LIMIT guide.
Common Mistakes with LWC Performance
- Calling Apex on every key press.
- Querying all fields without a LIMIT.
- Hiding big sections with CSS instead of lwc:if.
- Doing heavy loops in getters or renderedCallback.
- Leaving debug mode on for normal users.
Best Practices for LWC Performance
- Measure before and after every change.
- Prefer Lightning Data Service and cacheable Apex for reads.
- Return only the fields and rows you show.
- Debounce search inputs and page large lists.
- Keep each component small and focused.
Practice Task
Add a spinner that shows only while a page is loading. Hint: set an isLoading flag before changing offsetRows and clear it in the wired function, then use lwc:if around lightning-spinner.
Most Asked Interview Questions on LWC Performance
Senior LWC interviews almost always include performance. Here are the 21 questions asked most about LWC Performance.
Basic Questions on LWC Performance
Q1: What slows down an LWC most often?
Too many server calls, too much data and too much rendering.
Q2: How does caching help?
It reuses data instead of calling the server again.
Q3: What does cacheable=true do for performance?
It lets LWC serve repeated Apex reads from the cache.
Q4: Why use lwc:if instead of CSS to hide content?
Because lwc:if does not render the hidden part at all, so the DOM stays small.
Q5: What is debouncing?
Waiting until the user stops typing before running a search.
Q6: Why page large lists?
Because browsers slow down with thousands of DOM rows.
Q7: Does debug mode affect speed?
Yes, so keep it off for normal users.
Code and Scenario Questions on LWC Performance
Q8: How do you debounce in LWC?
Use setTimeout, and clear the previous timer on each key press.
Q9: How do you add Load more to a list?
Increase an offset parameter and append the new rows to the existing array.
Q10: Why return fewer fields from Apex?
Because smaller responses download and render faster.
Q11: How does lightning-datatable help with big data?
It supports infinite loading, so it fetches more rows as the user scrolls.
Q12: Why should keys be stable record Ids?
Because LWC can then update only the rows that changed.
Q13: Where should heavy calculations go?
In the code that runs once when data arrives, not in getters.
Q14: How do you find what is slow?
Use browser developer tools to check network calls and rendering time.
Advanced Questions on LWC Performance
Q15: When is Lightning Data Service faster than Apex?
For single records, because it shares a cache across components.
Q16: What is the OFFSET limit in SOQL?
2,000 rows, so use keyset paging for deeper lists.
Q17: How do many components on one page affect speed?
Each adds calls and rendering, so combine data needs and keep pages lean.
Q18: Why avoid work in renderedCallback?
Because it runs after every render, so slow code repeats often.
Q19: How can you lazy load a heavy section?
Render it with lwc:if only when the user opens it, such as on a tab click.
Q20: How do you avoid duplicate Apex calls from several components?
Use cacheable methods, or load once in a parent and pass data down.
Q21: How do you prove a performance fix worked?
Measure the same scenario before and after, and compare the numbers.
Official Resources
- Lightning Web Components Performance Best Practices (Salesforce Developers Blog)
- Use the Wire Service to Get Data (LWC Developer Guide)
Quick Recap
- LWC Performance depends on server calls, data size and rendering.
- Cache reads with Lightning Data Service and cacheable Apex.
- Ask for fewer fields and page large lists.
- Use lwc:if and debounce search input.
- Measure before and after every change.
What’s Next?
Some older parts of the org still use Aura. Next, read our guide to Aura Components basics for LWC developers.