Apex Performance Profiling means measuring where a transaction actually spends its budget rather than guessing. The platform gives you the numbers at runtime, and most slow code is fixed in one place once you can see which line costs what.
Guessing is the problem Apex Performance Profiling removes. Developers tend to blame the query, and the cost is usually a loop. Or they rewrite the loop, and the cost was a describe call made four hundred times.
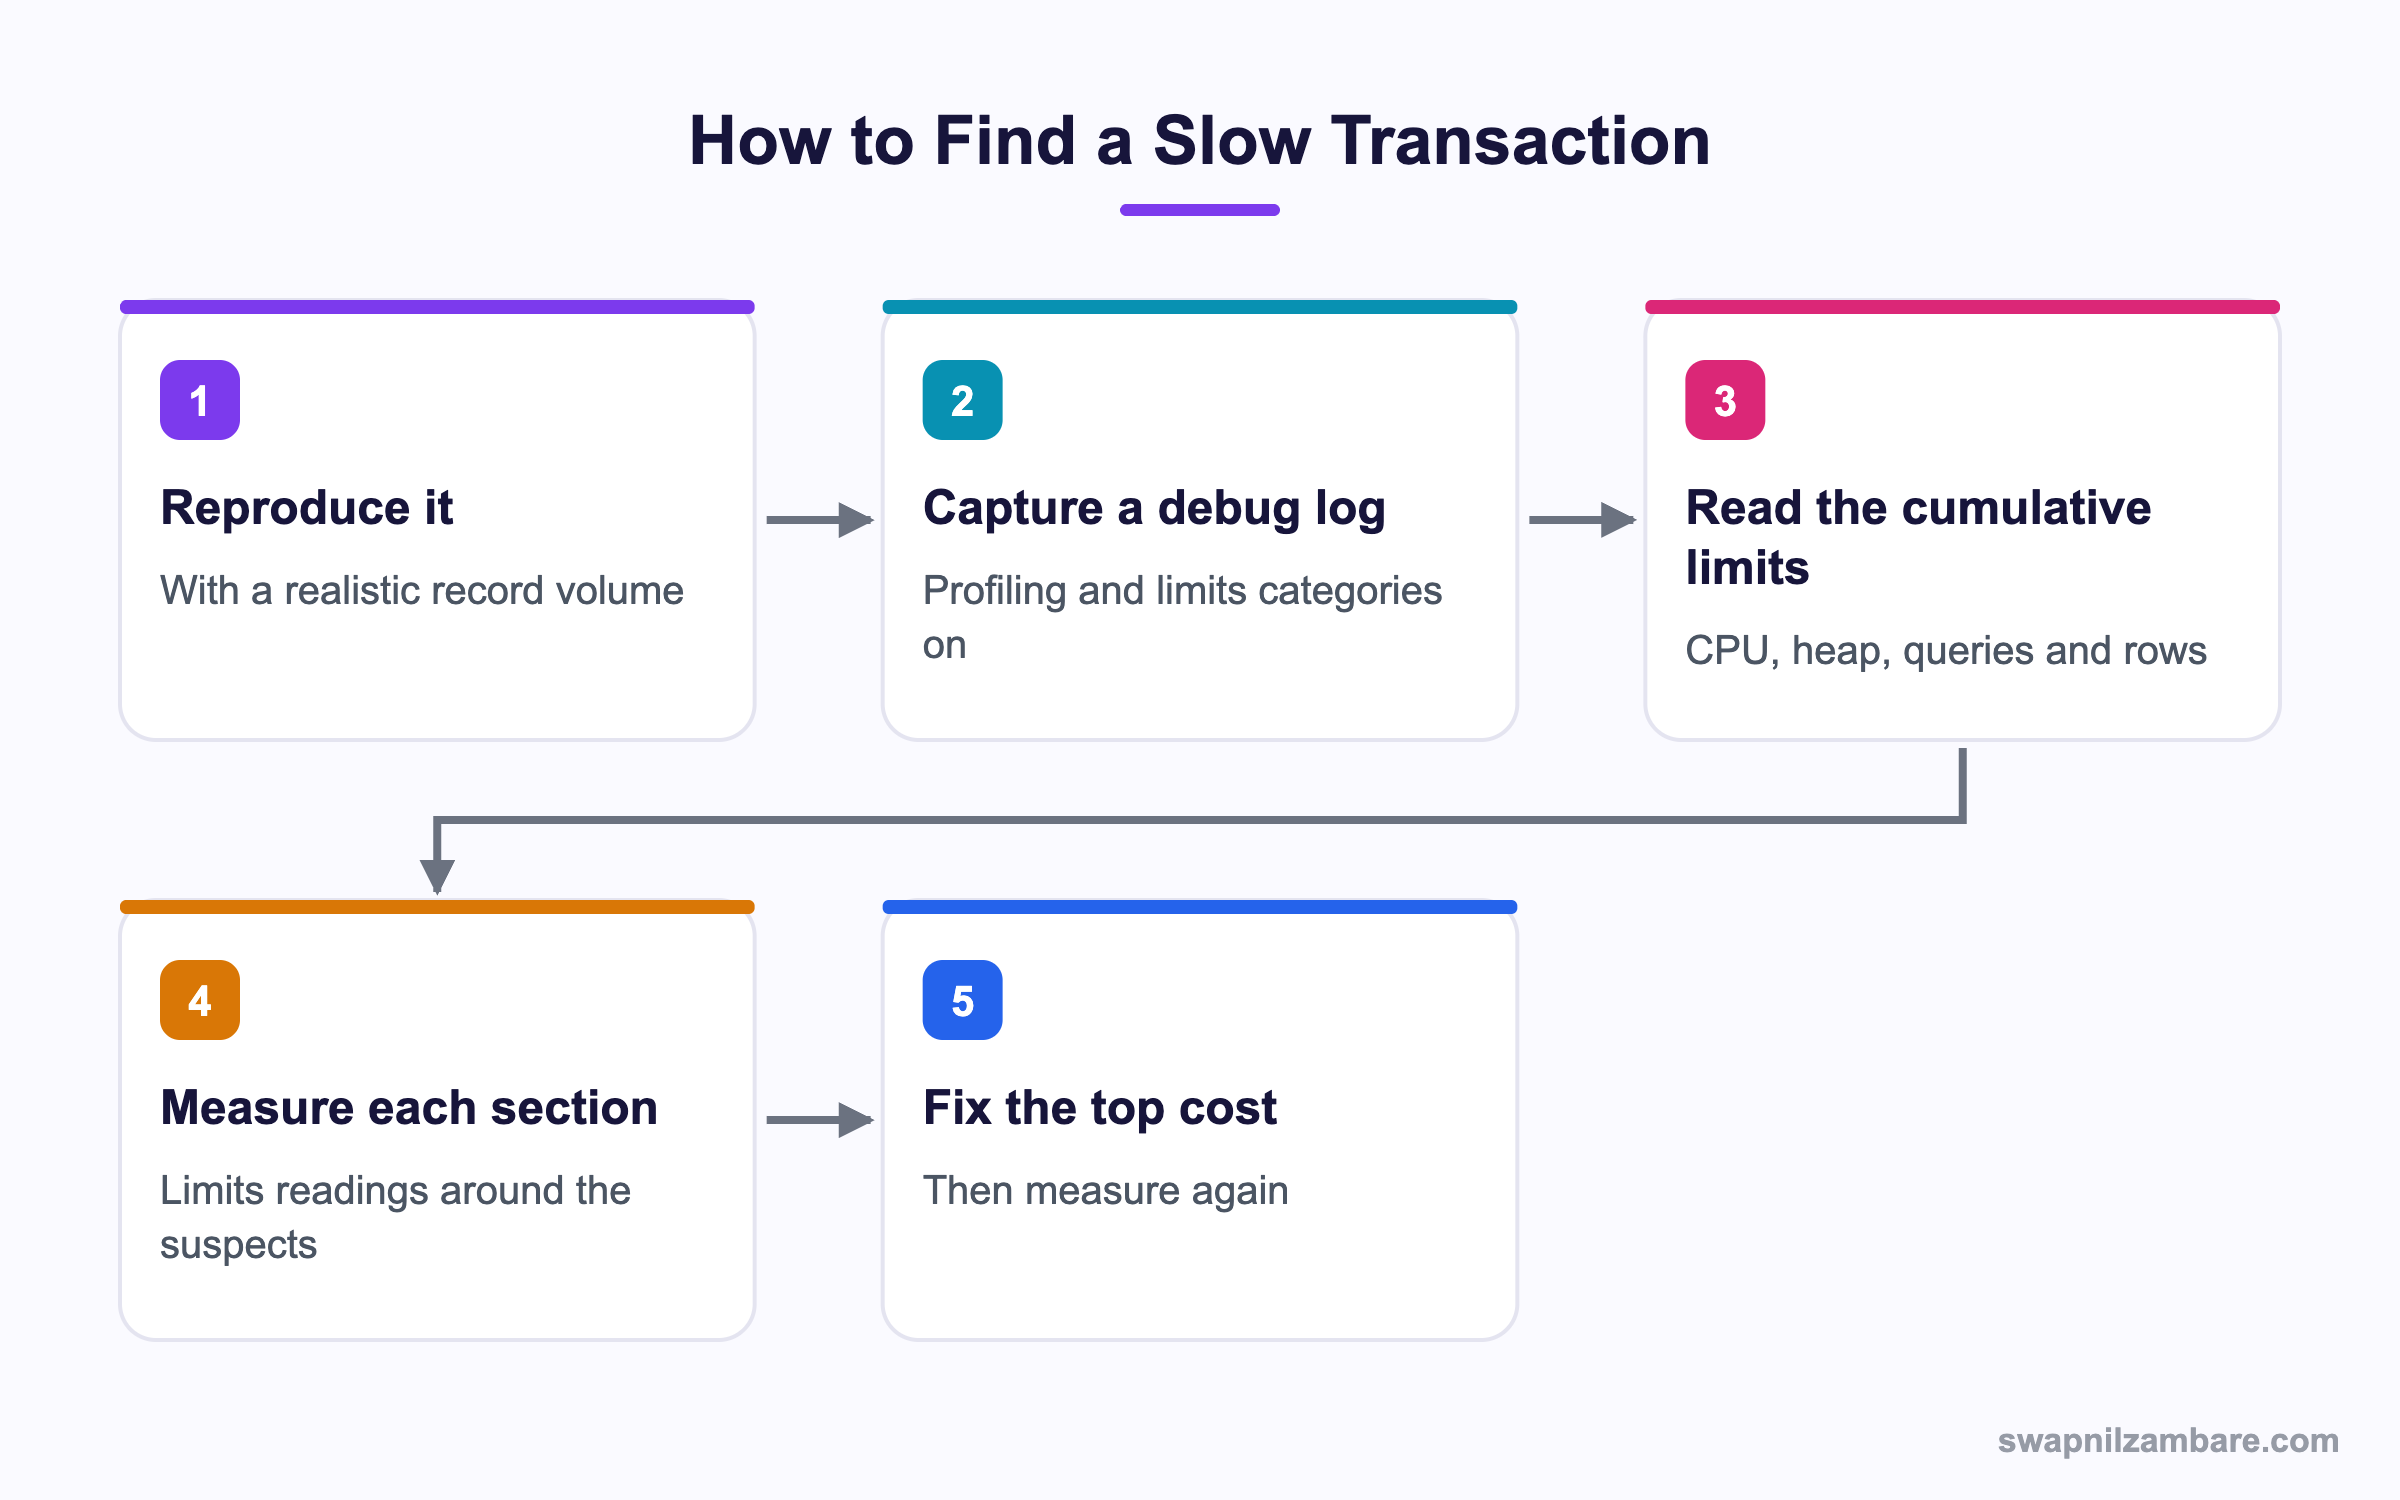
Caption: Measure, fix the biggest item, then measure again, because the next bottleneck is rarely the one you expected.
What Apex Performance Profiling Measures
In Apex Performance Profiling four numbers matter more than the rest.
| Limit | What it counts | Typical cause of trouble |
|---|---|---|
| CPU time | Work your code performs | Nested loops and repeated describes |
| Heap size | Memory held at once | Big collections kept for the whole method |
| SOQL queries | Query statements issued | A query inside a loop |
| Query rows | Rows returned across all queries | A query with no selective filter |
CPU time is the one that confuses people. Waiting on a callout or on the database round trip does not count, so a transaction can take ten seconds of wall clock time and use two seconds of CPU. The post on governor limits lists the ceilings.
Reading the Numbers at Runtime
Long cpuStart = Limits.getCpuTime();
Integer heapStart = Limits.getHeapSize();

calculateFees(courses);

System.debug(LoggingLevel.ERROR,
    'calculateFees cpu=' + (Limits.getCpuTime() - cpuStart)
    + ' heap=' + (Limits.getHeapSize() - heapStart)
    + ' soql=' + Limits.getQueries()
    + '/' + Limits.getLimitQueries());
Two details make Apex Performance Profiling practical. Logging at error level means the line survives when the log is filtered, and taking a reading before and after a block gives you the cost of that block rather than a running total.
| Method | What it returns |
|---|---|
| Limits.getCpuTime() | CPU milliseconds used so far |
| Limits.getHeapSize() | Heap bytes in use |
| Limits.getQueries() | Queries issued so far |
| Limits.getQueryRows() | Rows returned so far |
| Limits.getDmlStatements() | DML statements so far |
| Limits.getLimitCpuTime() | The ceiling for this transaction type |
Apex Performance Profiling with Debug Logs
For Apex Performance Profiling a debug log with everything turned up is useless, because the log fills and truncates before the interesting part. Set the categories deliberately.
| Category | Level for profiling |
|---|---|
| Apex Code | Debug, or Info when the log truncates |
| Apex Profiling | Finest |
| Database | Info |
| System | Info |
| Workflow | Error |
| Validation | Error |
The cumulative limits block at the end of the log is the first thing to read. It tells you which limit is close to its ceiling, which narrows the search before you read a single line of code.
A second habit saves time. If the log truncates, raise the start point rather than the detail. Reproduce the problem with fewer records, find the pattern, then confirm at full volume.
Where ApexGuru Fits in Apex Performance Profiling
ApexGuru is a Salesforce tool that looks at your Apex alongside runtime information from the org and suggests specific improvements, with the line and a reason. It appears in Setup for orgs whose plan includes it, so the first step is checking your own Setup rather than assuming.
What it is good at is the pattern a human reviewer skips.
| What ApexGuru tends to surface | Why it matters |
|---|---|
| A query inside a loop | The classic limit failure |
| A describe call repeated per record | Pure wasted CPU |
| A missing selective filter | Row limits and slow queries |
| Code paths that run on every save | Cost multiplied by volume |
| Nested loops over the same collection | Quadratic growth |
Treat ApexGuru as a reviewer rather than an oracle. It reports a cost and a line, and you still decide whether the fix is worth the change. Pair it with the static analysis in Code Analyzer, which looks at the code rather than the runtime.
Apex Performance Profiling for CPU or Heap
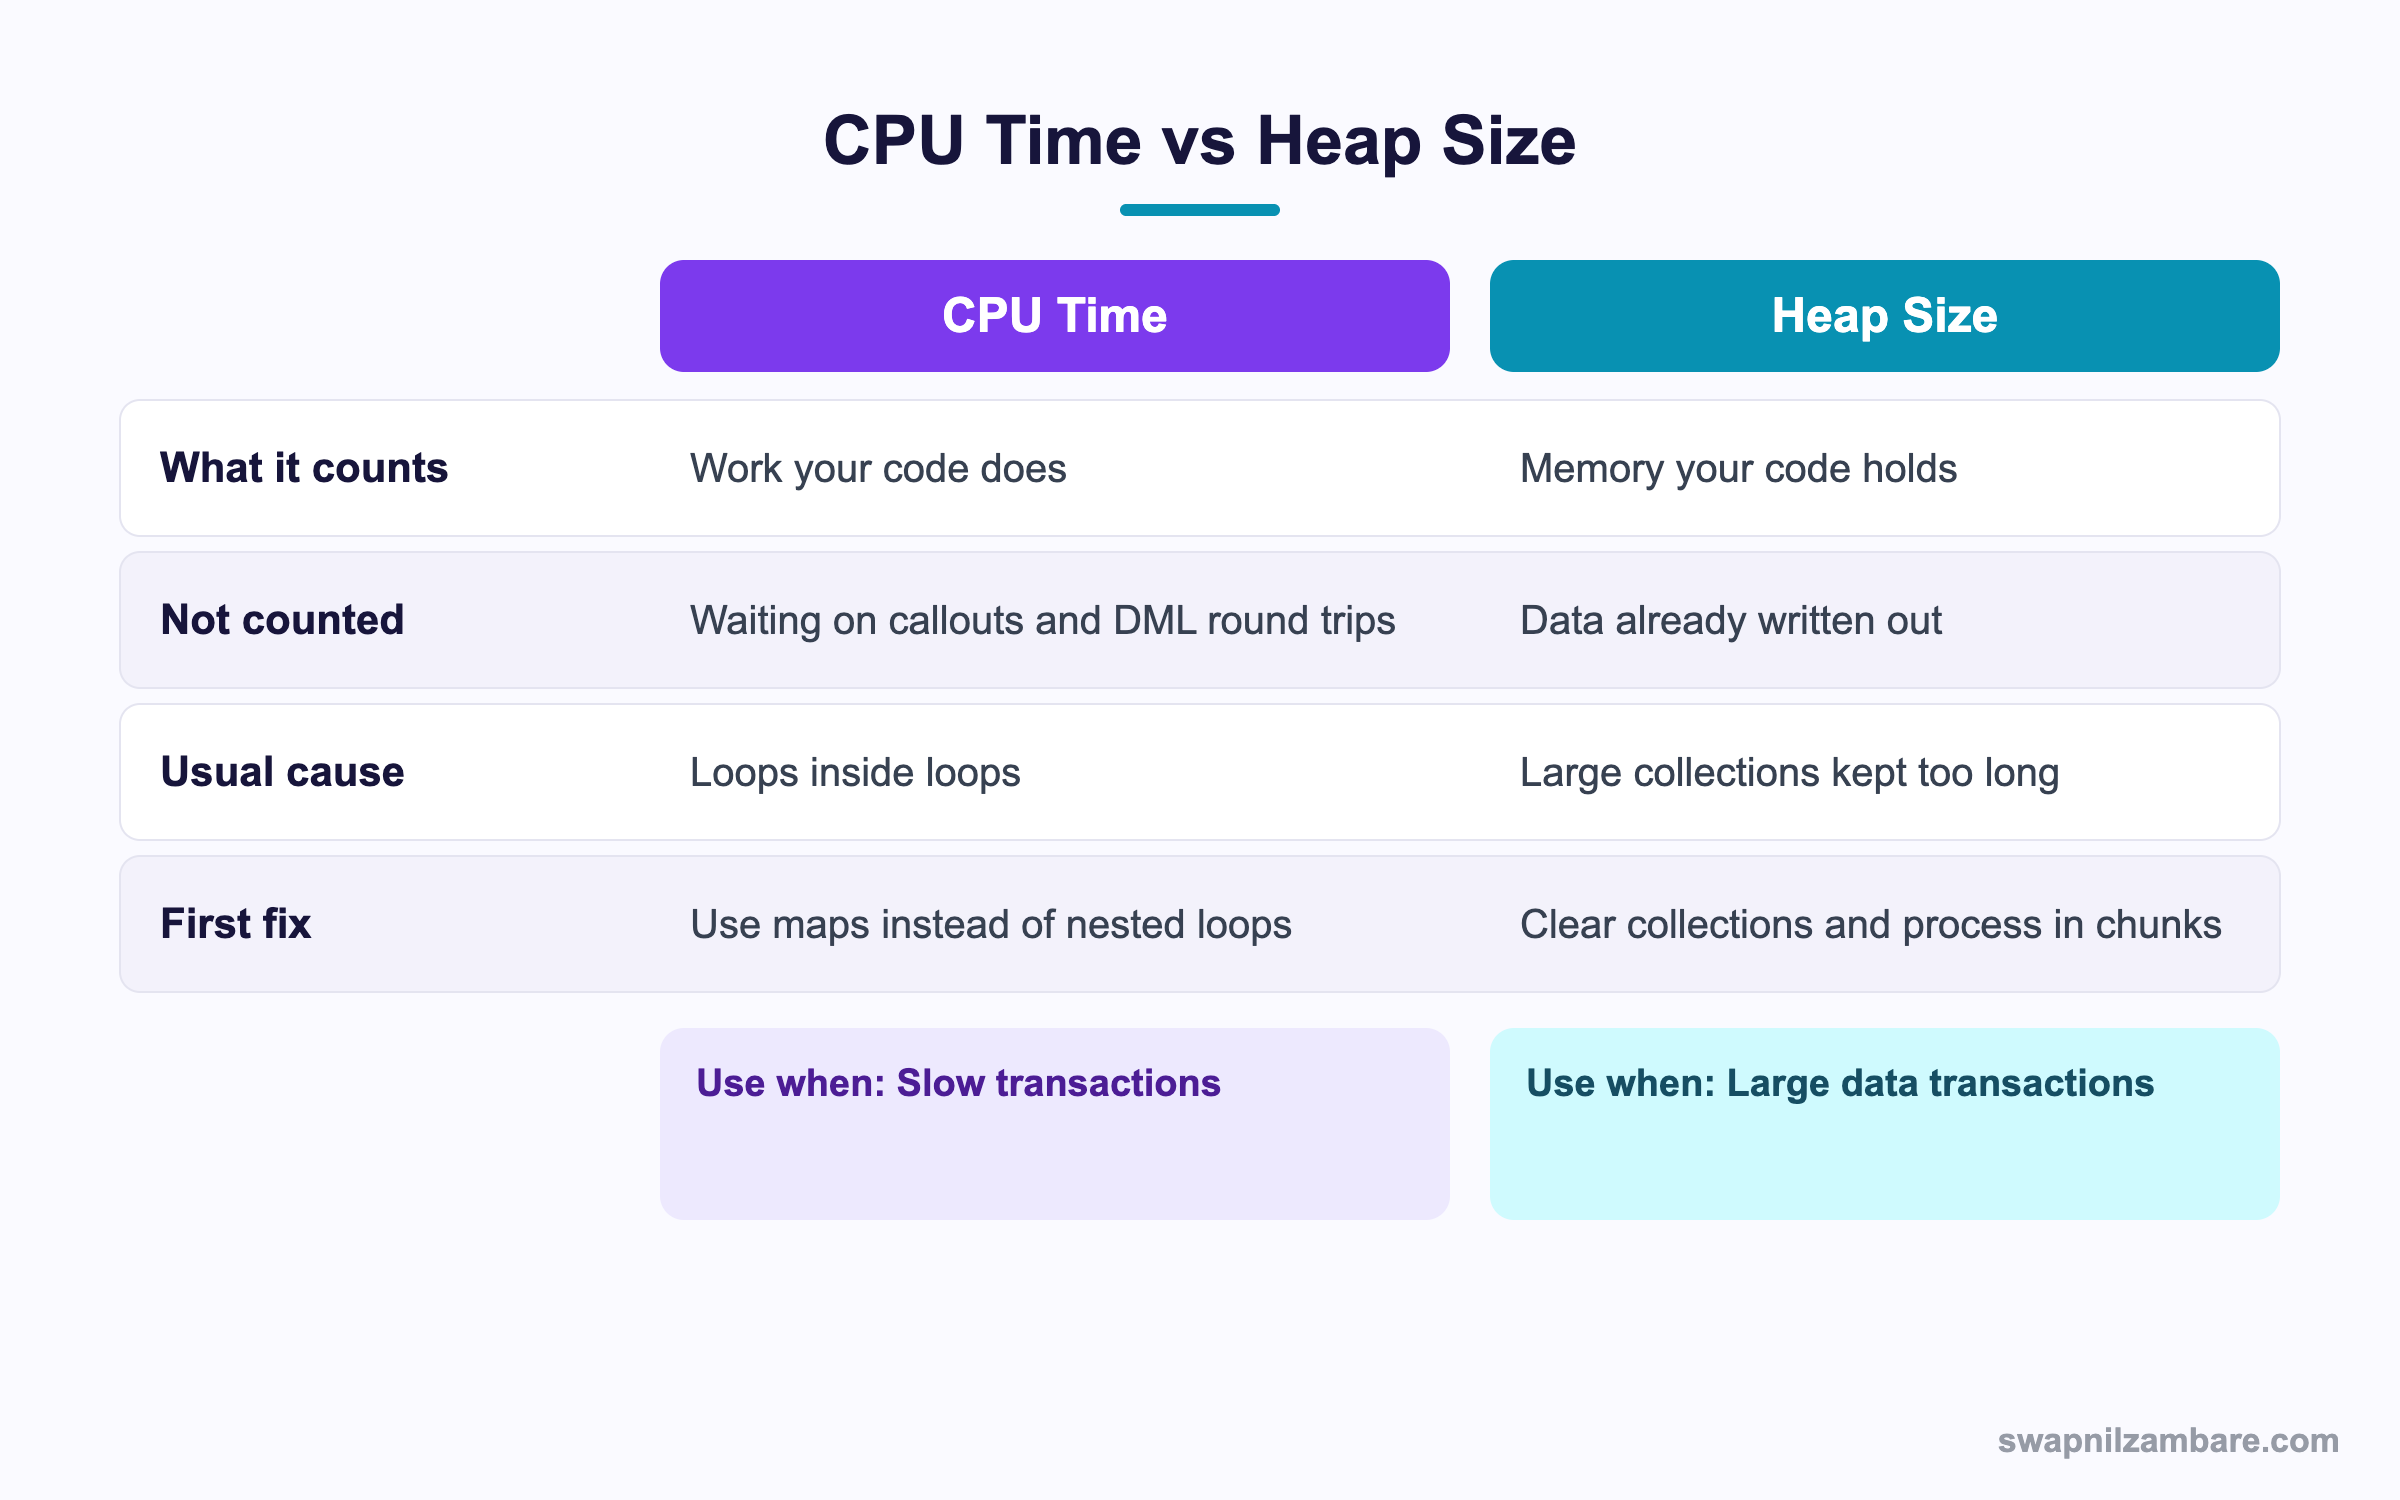
Caption: The fix is different for each, so identify which one is near its ceiling first.
Fixing CPU Time
// Costly, since the inner loop runs for every course
for (Course__c c : courses) {
    for (Enrolment__c e : enrolments) {
        if (e.Course__c == c.Id) {
            c.Seats_Taken__c++;
        }
    }
}

// Cheap, since each list is walked once
Map<Id, Integer> counts = new Map<Id, Integer>();
for (Enrolment__c e : enrolments) {
    Integer current = counts.containsKey(e.Course__c) ? counts.get(e.Course__c) : 0;
    counts.put(e.Course__c, current + 1);
}
for (Course__c c : courses) {
    c.Seats_Taken__c = counts.containsKey(c.Id) ? counts.get(c.Id) : 0;
}
Apex Performance Profiling makes this obvious. With 200 courses and 2,000 enrolments, the first version performs 400,000 comparisons and the second performs 2,200. That single change is the most common real fix in Apex Performance Profiling work.
Fixing Heap Size
- Query only the fields you use, since every extra field is memory per row
- Use a
forloop over a query rather than holding the full list - Clear a collection once you are finished with it
- Move large work into a queueable, which gets a higher heap ceiling
- Avoid serialising a large collection to a string, which doubles its footprint
for (List<Enrolment__c> chunk : [
    SELECT Id, Course__c FROM Enrolment__c WHERE Status__c = 'Active'
]) {
    process(chunk);
}
The query loop is the single best heap habit, and bulkification covers the wider pattern it belongs to. It pulls records in chunks rather than holding every row, and it reads almost the same as the version that fails.
A Real Apex Performance Profiling Example
Apex Performance Profiling settled an argument for us. Bright Path Tutors had an enrolment save that failed with a CPU time error whenever a bulk load ran. The team had rewritten the SOQL twice with no improvement.
Profiling took twenty minutes and told a different story.
| Section | CPU cost |
|---|---|
| The query everyone blamed | 110 ms |
| A describe call inside a loop | 3,400 ms |
| Fee calculation nested loops | 5,900 ms |
| Everything else | 420 ms |
| Fix | Result |
|---|---|
| Cache the describe result in a static map | 3,400 ms down to 15 ms |
| Replace the nested loop with a map | 5,900 ms down to 180 ms |
| Leave the query alone | No change needed |
| Measure | Before | After |
|---|---|---|
| CPU time for 200 records | 9,830 ms | 725 ms |
| Bulk load failures | Every run | None |
| Time spent on the fix | 20 minutes profiling, 1 hour coding |
The Apex Performance Profiling lesson was cheap and worth repeating. Two days had already gone into rewriting the query that cost one percent of the transaction.
Common Mistakes with Apex Performance Profiling
| Mistake | What happens | Fix |
|---|---|---|
| Optimising before measuring | Days spent on the wrong line | Profile first, every time |
| Testing with one record | The problem never appears | Reproduce at realistic volume |
| All log categories on finest | The log truncates before the cause | Set categories deliberately |
| Reading only the total CPU | No idea which section costs what | Take readings around each block |
| Blaming wall clock time | Chasing a callout that CPU ignores | Separate waiting from CPU |
| Describes inside loops | Thousands of milliseconds wasted | Cache them in a static |
| Holding every row in a list | Heap failures at volume | Use a query for loop |
Best Practices for Apex Performance Profiling
- Reproduce the problem at the volume that fails before changing anything
- Take limit readings around each suspect block rather than once at the end
- Log at error level so the measurements survive log filtering
- Read the cumulative limits section of the log first
- Cache describe results and other repeated lookups in statics
- Replace nested loops with maps as a reflex
- Fix one thing, measure again, and stop when the limit is comfortable
- Check whether ApexGuru is available in your org and act on what it reports
Most Asked Apex Performance Profiling Interview Questions
Q1: What does CPU time count?
Work your code performs. Waiting on callouts and database round trips is not counted.
Q2: Why can a slow transaction show low CPU time?
Because the time went on waiting, which the CPU limit ignores.
Q3: How do you measure the cost of one block of code?
Read the limits before and after it and subtract.
Q4: Which method gives CPU time used so far?
Limits.getCpuTime.
Q5: How do you find the ceiling for the current transaction?
With the matching limit method, such as getLimitCpuTime.
Q6: Why log at error level during profiling?
So the measurements survive when the log level filters out debug lines.
Q7: Which log categories matter for profiling?
Apex Profiling at the finest level, with Apex Code at debug, and the rest kept low.
Q8: What do you read first in a debug log?
The cumulative limits section, which shows which limit is close to its ceiling.
Q9: What do you do when a log truncates?
Reduce the data volume or the detail, find the pattern, then confirm at full volume.
Q10: What is the most common CPU problem in Apex?
A loop inside a loop over two collections, which should be a map lookup.
Q11: How much difference does that change make?
With 200 and 2,000 records, hundreds of thousands of comparisons become a few thousand.
Q12: What is the second most common CPU problem?
A describe call or similar lookup repeated per record instead of cached.
Q13: How do you cache a describe result?
In a static map, built once per transaction.
Q14: What causes heap failures?
Holding large collections in memory, often with more fields than the code uses.
Q15: What is the best heap habit?
A for loop directly over a query, which processes records in chunks.
Q16: Does asynchronous Apex get different limits?
Yes. CPU and heap ceilings are higher in asynchronous contexts.
Q17: Is moving work to a queueable a performance fix?
It raises the ceiling, which buys room, but inefficient code is still inefficient.
Q18: What is ApexGuru?
A Salesforce tool that reviews Apex with runtime information and suggests specific improvements.
Q19: Where do you find it?
In Setup, for orgs whose plan includes it, so check your own org rather than assuming.
Q20: What does it tend to surface?
Queries in loops, repeated describes, missing selective filters and nested loops.
Q21: How does it differ from Code Analyzer?
Code Analyzer is static analysis of the code, while ApexGuru also considers how the code runs.
Q22: Should you accept every suggestion?
No. Treat it as a reviewer and judge whether each fix is worth the change.
Q23: Scenario: a trigger fails on CPU at 200 records but passes at 50. What do you suspect?
Work that grows faster than the record count, which usually means nested loops.
Q24: Scenario: the query was rewritten twice with no gain. What went wrong?
Nobody profiled, so the real cost was somewhere else.
Q25: Scenario: heap fails only on the largest accounts. Why?
A collection sized by related records, held in memory rather than chunked.
Q26: Scenario: the log has no cumulative limits section. What happened?
The log truncated, so lower the detail or the volume and capture it again.
Q27: How do you prove a fix worked?
Measure the same transaction again at the same volume and compare the numbers.
Q28: When do you stop optimising?
When the limit usage is comfortable at realistic volume, not when the code looks clever.
Q29: What is the one habit that makes profiling pay off?
Measure before you change anything, and measure again after.
Official Resources
What Is Next
Next, read AppExchange Security Review and Managed Packages.