Salesforce Report Charts turn rows of numbers into pictures that people understand in seconds. You can add them inside reports, on dashboards and even on a record page. For example, an Account page can show a chart of that school’s enrolments by month.
This post builds on reports and dashboards basics and dynamic dashboards. We will add charts for Bright Path Tutors and choose the right dashboard components.
What are Salesforce Report Charts?
Salesforce Report Charts are visual charts built from summary or matrix reports. They show grouped data as bars, lines, donuts and more. A chart can live in the report, on a dashboard or inside a Lightning record page.
Think of a report as a long bill and the chart as the pie on a bank statement. The bill has every detail. However, the pie tells you at a glance where most money went.
Why Salesforce Report Charts Matter
People rarely read long tables. Instead, they look for a trend or the biggest bar. So a good chart gets more attention than a perfect table.
Also, charts on record pages bring numbers to where users work. A sales rep sees an account’s history without opening a report. As a result, Salesforce Report Charts raise both adoption and speed.
How Salesforce Report Charts Work
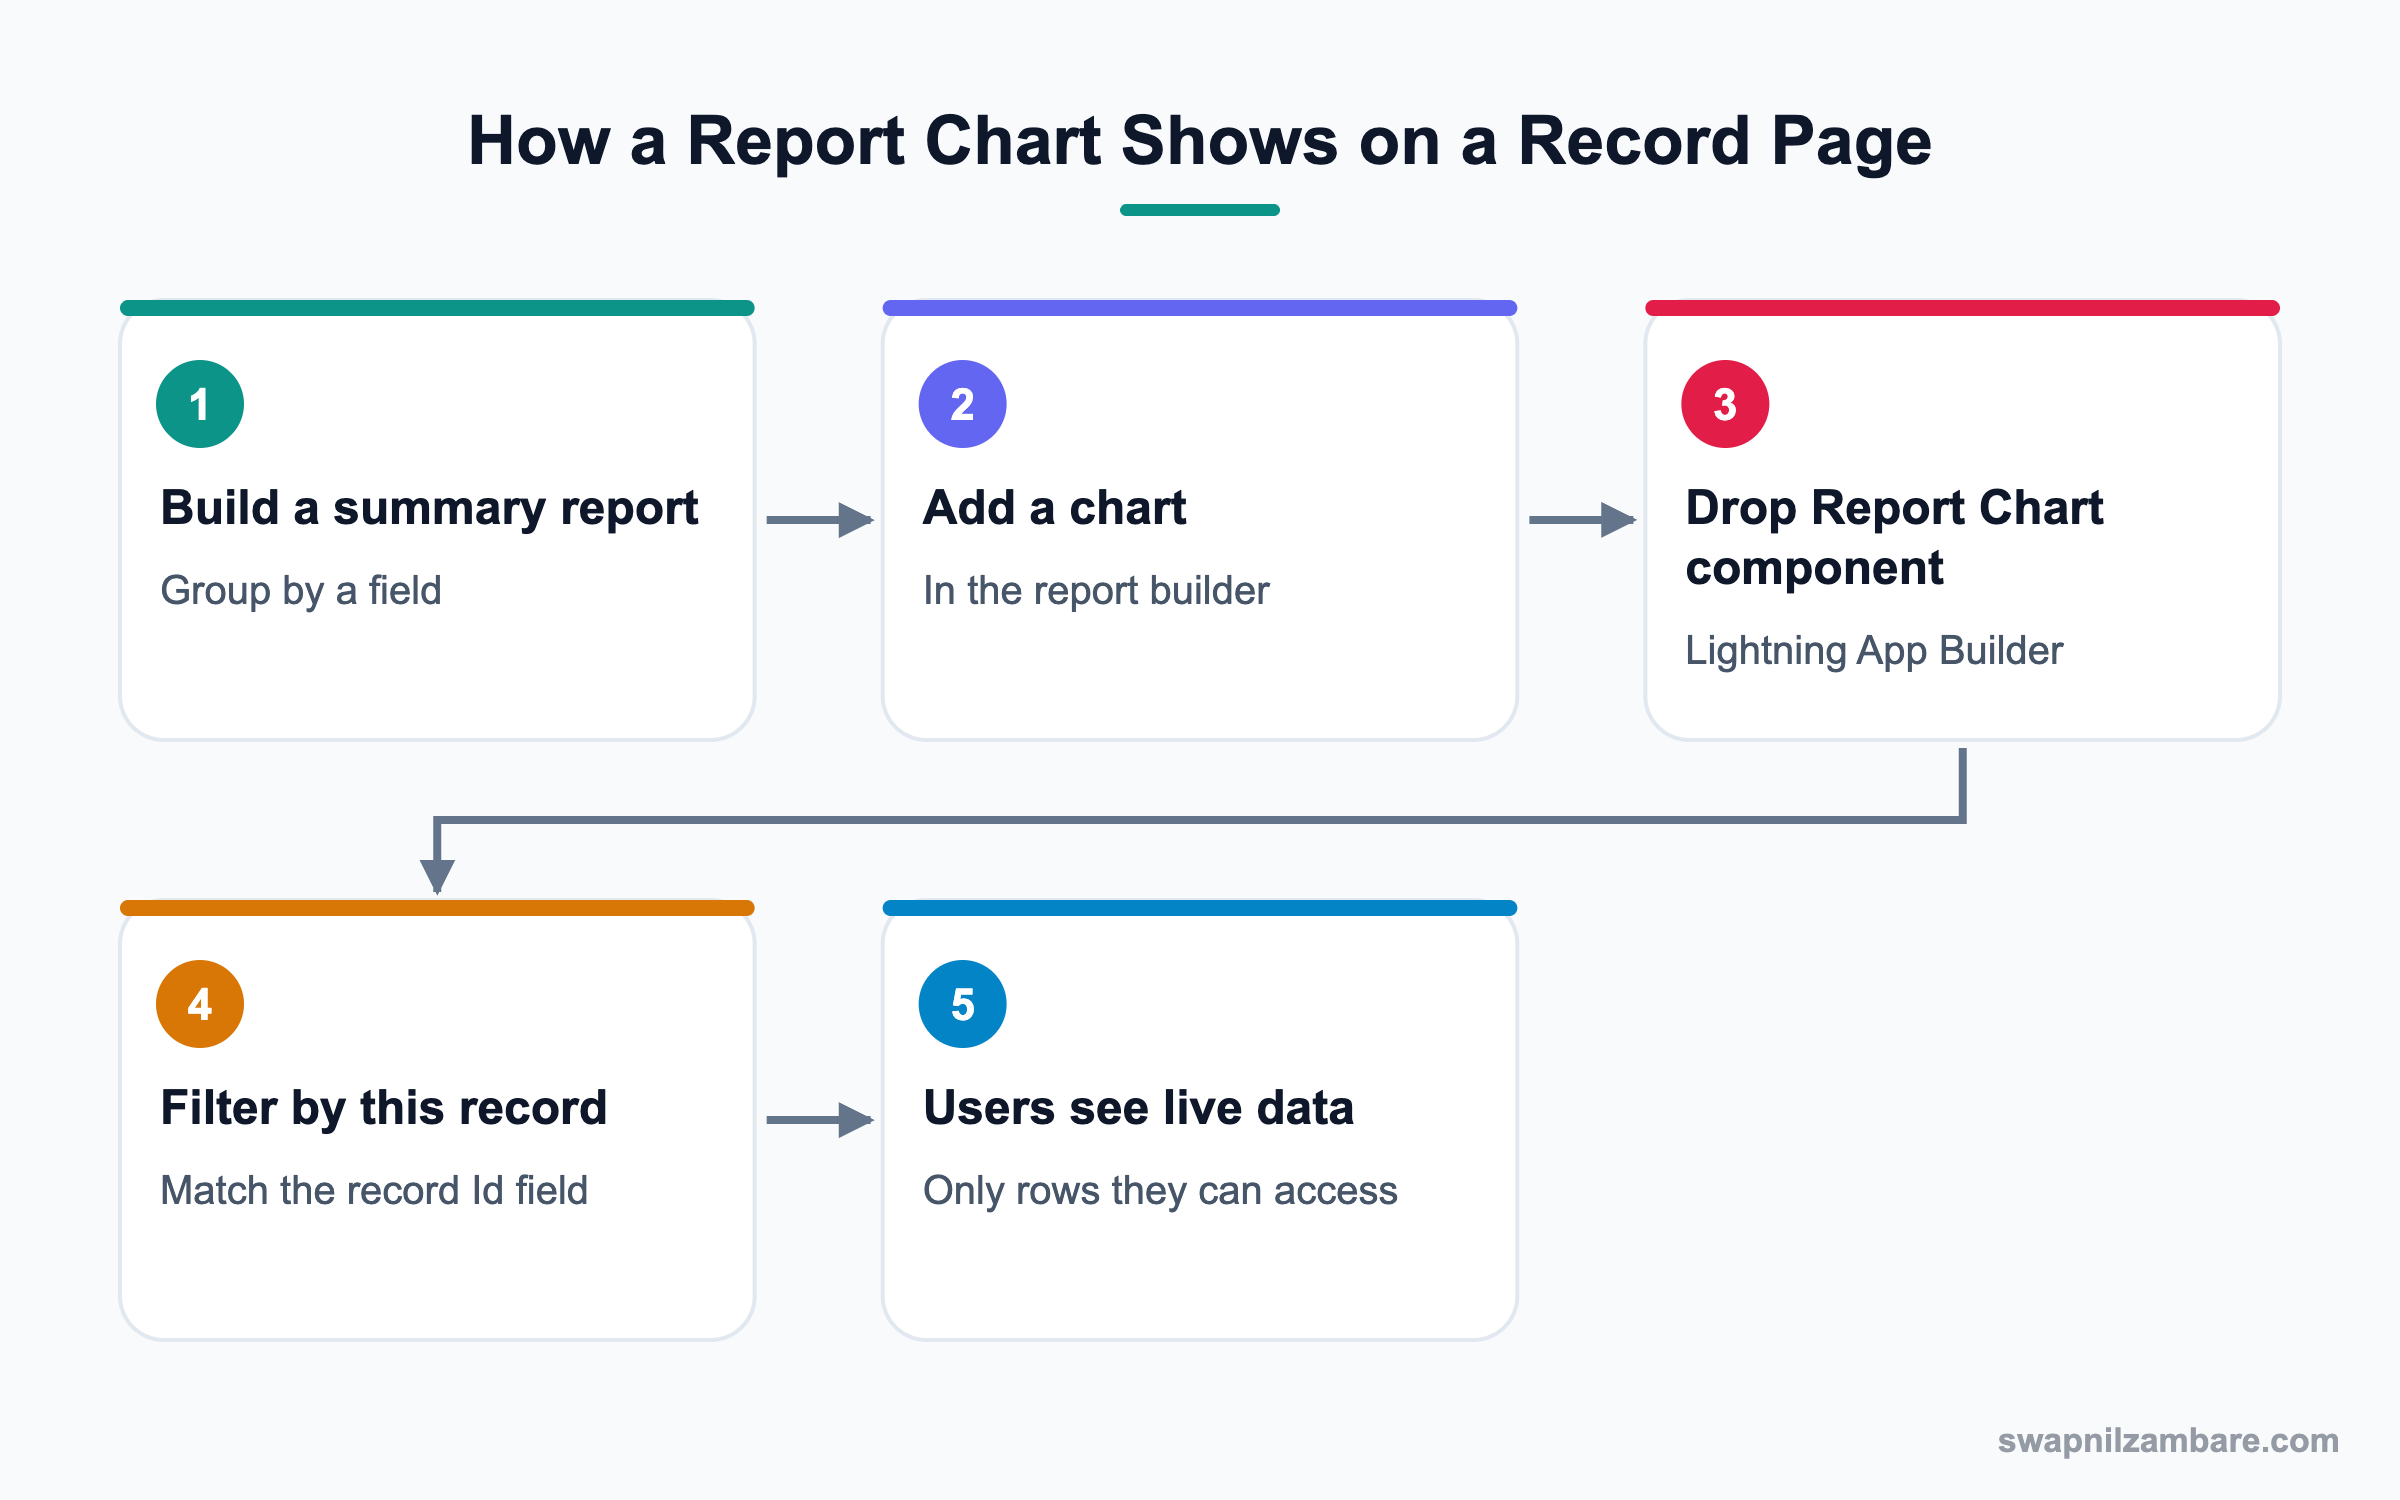
First, Salesforce Report Charts need a report with at least one grouping. Then the chart plots the summary values for each group. Embedded charts on record pages also filter by the record you are viewing.
Charts Inside a Report
In the report builder, click Add Chart. Then choose the chart type and the values. The chart shows above the report table.
Report Chart Component on a Record Page
In Lightning App Builder, drag the Report Chart component onto a record page. Pick the report and choose the field that matches the record, such as Account ID. Then the chart shows only that record’s data.
Dashboard Components
A dashboard is a group of components, each showing one source report. Each component has a type, such as bar chart, line chart, donut, gauge, metric, funnel, scatter or table.
Dashboard Component Types for Salesforce Report Charts
This table helps you pick the right type for the question you want to answer.
| Component type | Best for | Example |
|---|---|---|
| Bar or column chart | Comparing groups | Enrolments by course |
| Stacked bar | Parts of a whole by group | Enrolments by course and level |
| Line chart | Trends over time | Revenue by month |
| Donut | Share of a total | Leads by source |
| Funnel | Stages of a process | Opportunities by stage |
| Gauge | Progress to a target | Fees collected vs goal |
| Metric | One key number | Total open cases |
| Table or Lightning Table | Top lists | Top 10 accounts by revenue |
Bar Chart vs Metric
These two are the most used components. This table compares them.
| Feature | Bar chart | Metric |
|---|---|---|
| Shows | Many groups | One number |
| Needs grouping | Yes | No |
| Answers | Which is biggest? | Where are we now? |
| Space used | Medium to large | Small |
| Best placed | Middle of dashboard | Top row |
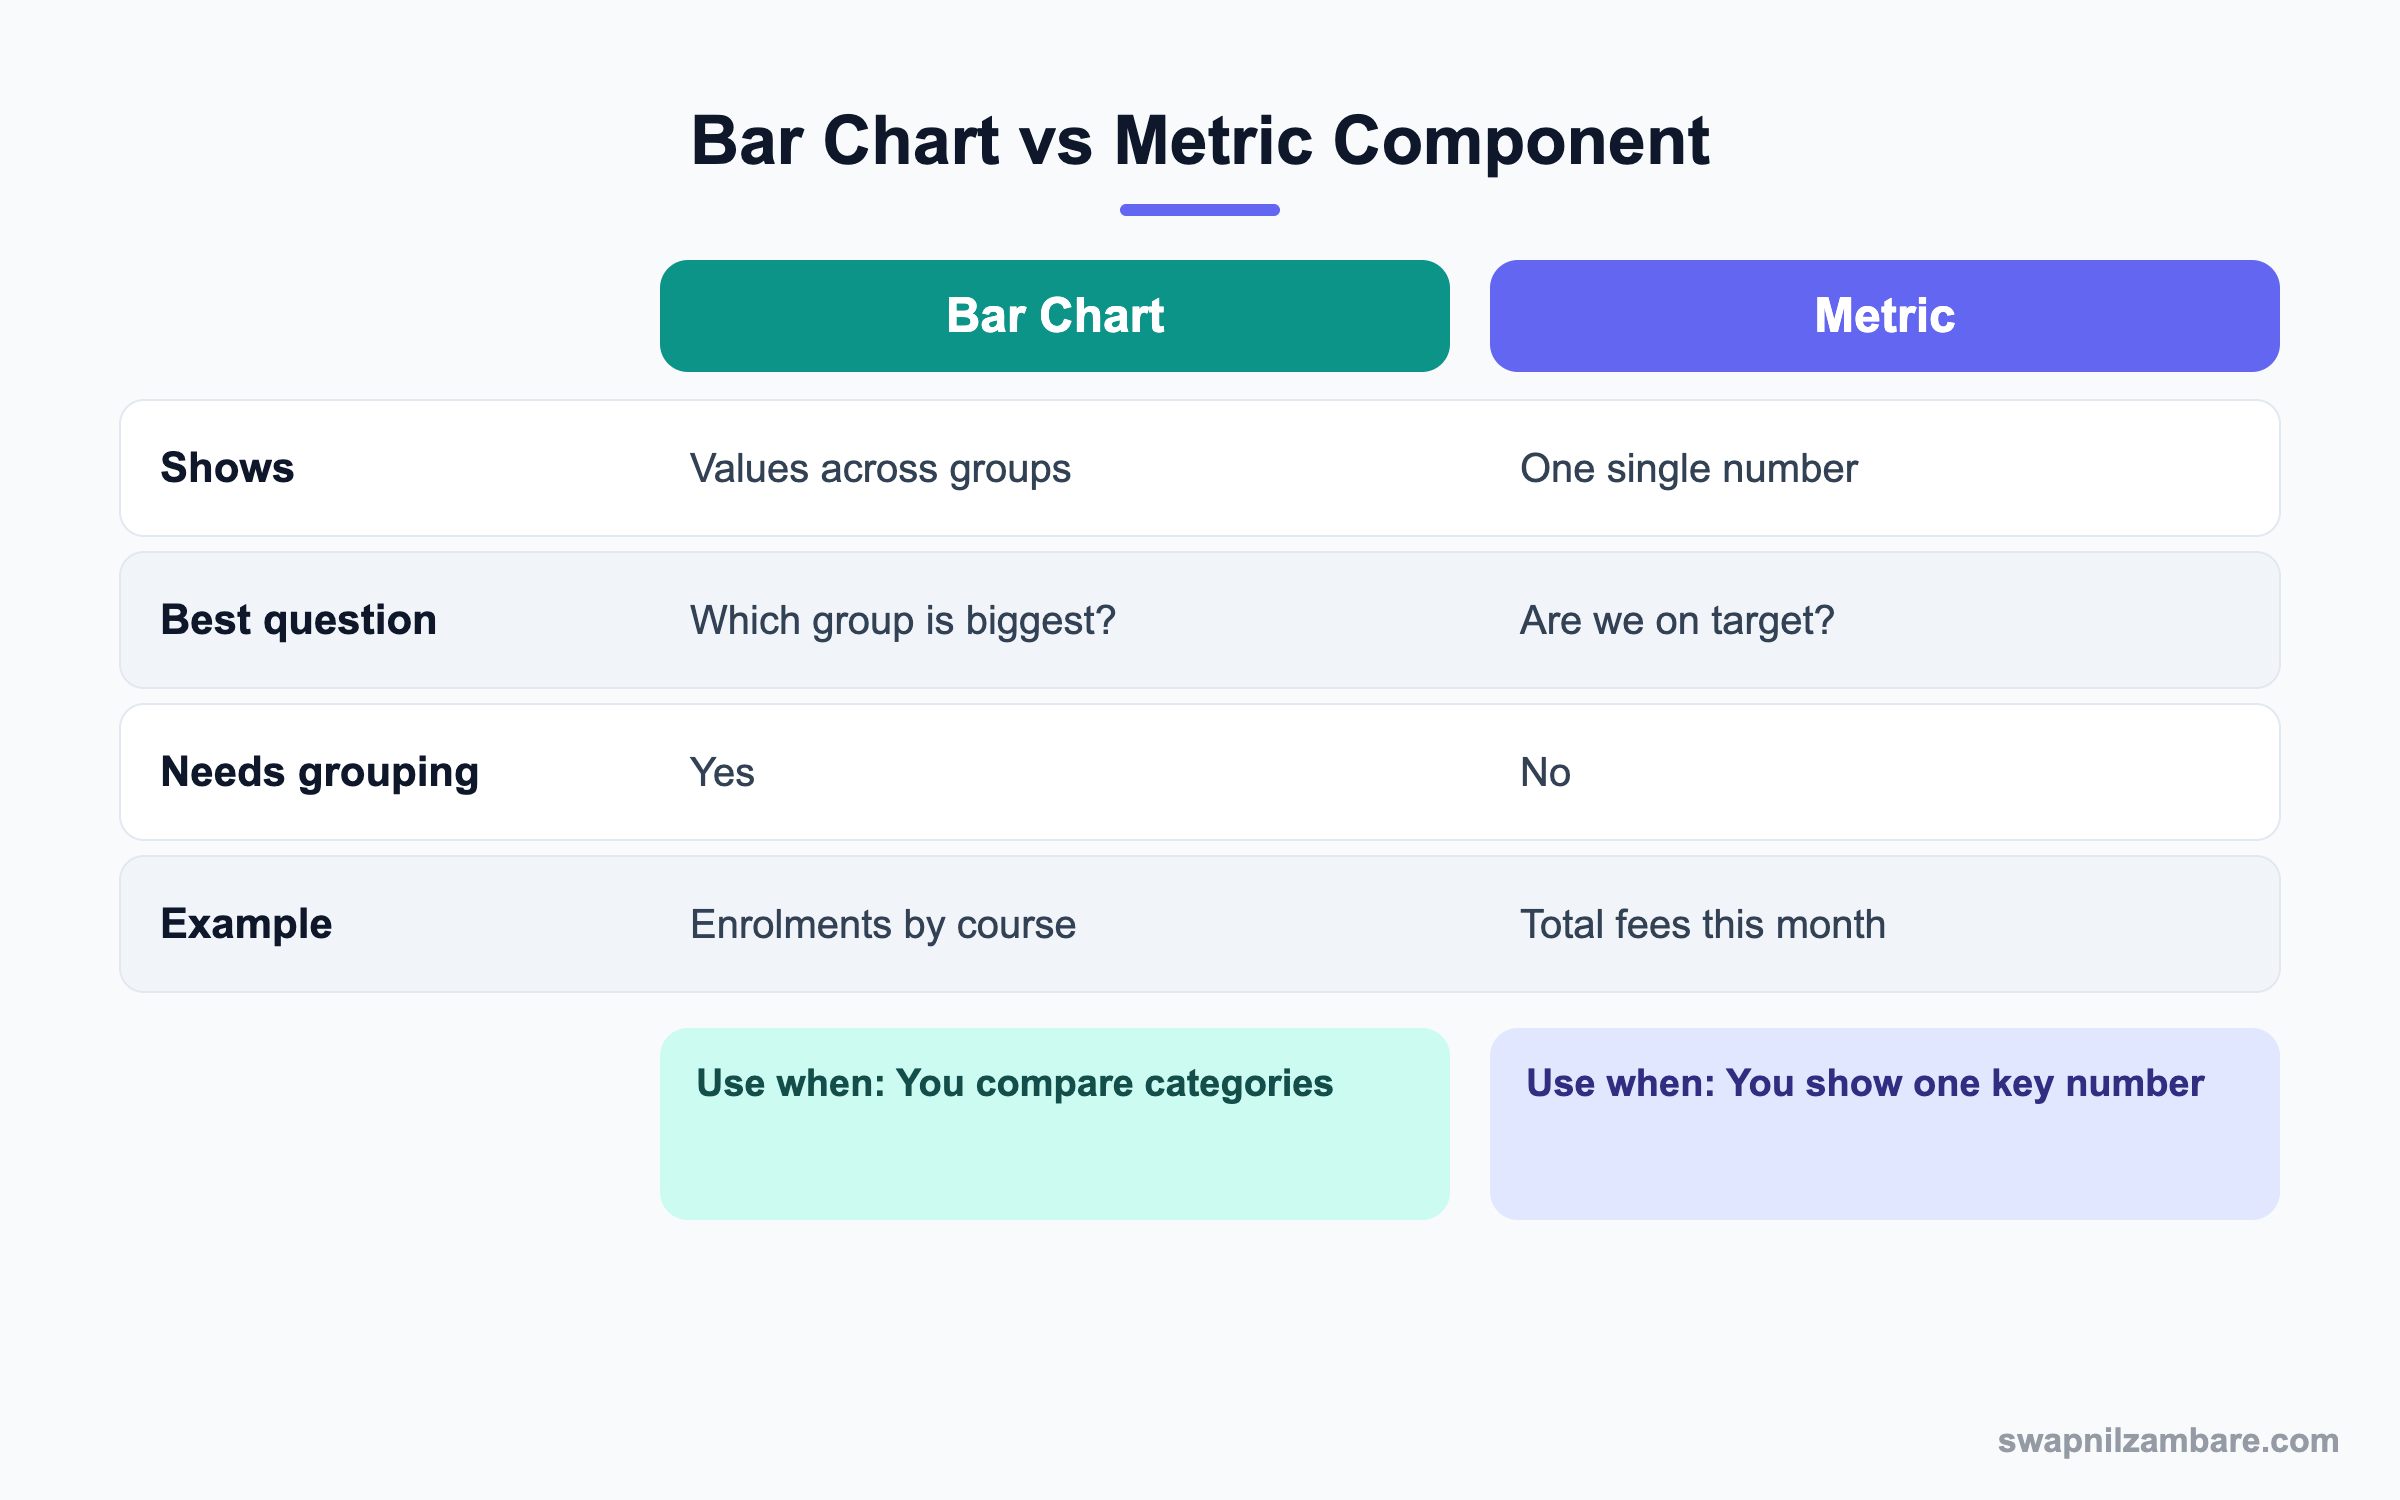
In short, put metrics in the top row for quick status. Then add bar and line charts below for detail.
A Real Salesforce Report Charts Example
Bright Path Tutors wants each school Account page to show enrolments by month. The sales head also wants a dashboard with clear charts. Let’s build both.
Step 1: Build the Source Report
- Open Reports and click New Report.
- Choose the report type Accounts with Enrolments.
- Group rows by Enrolment Date, by Calendar Month.
- Add the Record Count summary and save it in a shared folder as Enrolments by Month.
Step 2: Add a Chart to the Report
- Click Add Chart in the report.
- Choose Vertical Bar and keep Record Count as the value.
- Save the report.
Step 3: Put the Chart on the Account Page
- Open an Account record and click Edit Page.
- Drag Report Chart into the right sidebar.
- Pick the report Enrolments by Month.
- Set Filter by to Account ID and tick Refresh on page load if needed.
- Save and activate the page.
These are the component settings we used.
| Property | Value |
|---|---|
| Report | Enrolments by Month |
| Label | Enrolments for this school |
| Filter by | Account ID |
| Show refresh button | Checked |
| Visibility | Sales User profile |
Step 4: Build the Dashboard Rows
- Create a dashboard called Sales Overview.
- Add three Metric components in the top row: Total Leads, Enrolments This Month and Fees Collected.
- Add a Gauge for Fees Collected vs the monthly goal.
- Add a Line chart of revenue by month and a Funnel of opportunities by stage.
- Save and set the running user.
Common Mistakes with Salesforce Report Charts
- Using a donut with fifteen slices, which nobody can read.
- Building a chart on a report with no grouping, so nothing shows.
- Forgetting the Filter by field, so the record page shows all data.
- Saving the source report in a private folder.
- Mixing too many colours and labels on one chart.
Best Practices for Salesforce Report Charts
- Ask what question the chart answers before choosing a type.
- Keep five to seven groups per chart, and group the rest as Other.
- Put key metrics at the top of a dashboard.
- Use clear titles like “Enrolments this month” instead of report names.
- Check access to source report folders for every user group.
Practice Task
Create a report of Opportunities grouped by Stage with a funnel chart. Then add a Report Chart component to the Account page filtered by Account ID. Hint: the report must include the Account ID field to filter by it.
Most Asked Salesforce Report Charts Interview Questions
These Salesforce Report Charts and dashboard questions come up in most admin interviews.
Basic Salesforce Report Charts Interview Questions
Q1: What is a report chart?
Salesforce Report Charts are visual charts built from a summary or matrix report. It shows grouped values as bars, lines, donuts and more.
Q2: Which report formats support charts?
Summary and matrix reports, because charts need groupings. Tabular reports need a row limit and grouping to be used in dashboards.
Q3: How do you add a chart to a report?
Open the report in the builder and click Add Chart. Then choose the type and values.
Q4: What dashboard component types are available?
Bar, column, stacked, line, donut, funnel, scatter, gauge, metric, table and Lightning Table components are common choices.
Q5: When would you use a gauge?
Use it when you show progress toward a target, like fees collected against a monthly goal.
Q6: When would you use a metric component?
Use it when one number matters most, like total open cases. Metrics usually sit in the top row.
Q7: What is a source report?
It is the report that feeds a dashboard component, so its filters shape the chart. Each component uses one source report.
Intermediate Salesforce Report Charts Interview Questions
Q8: How do you show a report chart on a record page?
Use the Report Chart component in Lightning App Builder. Pick the report and set Filter by to the matching Id field.
Q9: Why does a record page chart show all data instead of one record’s data?
The Filter by setting is missing, or the report lacks the needed Id field. Add the field and set the filter.
Q10: What is the running user of a dashboard?
It is the user whose access decides what data the dashboard shows. Dynamic dashboards use the viewer instead.
Q11: What is the difference between a table and a Lightning Table component?
A table shows grouped summary values. A Lightning Table can show detail columns from the report, sorted and limited.
Q12: How do you show the top ten accounts by revenue?
Group by account, sort by revenue descending and set the row limit to ten. Then use a table or bar chart.
Q13: Can a chart use more than one value?
Some charts, like combination charts in reports, can show a second value as a line. Dashboards also support grouped bar charts.
Q14: What is a funnel chart good for?
It shows how records move through stages, like opportunities from Prospecting to Closed Won.
Advanced Salesforce Report Charts Interview Questions
Q15: Scenario: a manager says the dashboard numbers are wrong. What do you check?
Check the running user, filters, date ranges and the source report. Then compare with a fresh report run by the manager.
Q16: How do you keep dashboards fast?
Use fewer components, simple reports and selective filters. Also refresh on a schedule instead of on every open.
Q17: Scenario: users want a chart that reports cannot build. What next?
Try a joined report or a custom report type first. If still not possible, consider CRM Analytics or a custom component.
Q18: How would you design a dashboard for executives?
Start with three or four metrics, then trend and comparison charts. Keep labels simple and add a link to details.
Q19: How do Salesforce Report Charts respect security?
Embedded charts show only data the viewing user can access. Dashboards follow the running user or the viewer, if dynamic.
Q20: What is a combination chart?
It shows bars and a line together, such as enrolment count as bars and revenue as a line. It helps compare two related values.
Q21: How many Salesforce Report Charts can one record page hold?
There is no strict small limit, but each chart runs a report. So keep it to one or two charts for speed.
Q22: Do Salesforce Report Charts on record pages refresh automatically?
They use cached data that can refresh on page load or with the refresh button. Then users can click refresh for the latest numbers.
Q23: Why is a donut chart hard to read with many groups?
Because thin slices look alike and labels overlap. So use a bar chart when there are more than six groups.
Q24: Can you add a chart to a joined report?
Yes. A joined report can have a chart based on one of its blocks or on cross-block values. However, choose the values carefully.
Q25: How do you give Salesforce Report Charts a consistent look?
Use the same colours for the same values, clear titles and sorted groups. Also, reuse a small set of chart types across dashboards.
Q26: When should you use a scatter chart?
Use it to see a link between two numbers, like course fee and enrolments. So it shows patterns, not totals.
Official Resources
- Salesforce Help: Add a Report Chart to a Lightning Page
- Salesforce Help: Dashboard Components
- Trailhead: Reports and Dashboards for Lightning Experience
Quick Recap
- Salesforce Report Charts show grouped report data as visuals.
- A chart needs a summary or matrix report with groupings.
- The Report Chart component puts a filtered chart on a record page.
- Pick the dashboard component type based on the question.
- Metrics go on top, and detail charts go below.
What’s Next?
Next, we design better emails with Lightning Email Templates and Letterheads.