Apex Debug Logs record what happened inside a Salesforce transaction: every query, DML statement, debug message, limit and error. When a test fails or a user reports a strange value, the log is usually the fastest way to find the cause. Checkpoints and the Replay Debugger then let you look at variable values line by line.
In this post, you will learn how to switch logging on with trace flags, how to read the most useful log lines, and how to step through code with the Apex Replay Debugger in VS Code. It builds on the Developer Console guide, Salesforce CLI and VS Code setup and running Apex tests from the CLI. This is the last post of Level 5.
What are Apex Debug Logs?
Apex Debug Logs are text files that Salesforce writes while a transaction runs. Each line has a timestamp, an event name such as SOQL_EXECUTE_BEGIN or USER_DEBUG, and details. You choose how much detail to record with a debug level.
Think of a flight’s black box recorder. It records speed, height and every switch the pilot touches. After a problem, investigators replay it to see exactly what happened. A debug log is the black box for your transaction.
Why Apex Debug Logs Matter
Bugs rarely show up while you watch. Here is why Apex Debug Logs matter at Bright Path Tutors.
- First, a user says an enrolment got the wrong Amount_Due__c, and you need to see which automation set it.
- Also, a test fails in CI, and the log shows the exact exception and line.
- Next, the log lists limit usage, so you can spot a query inside a loop.
- Some bugs depend on user data, so you must log as that user.
- Finally, the Replay Debugger needs a log to replay.
So reading logs is a core developer skill, not an optional extra.
How Apex Debug Logs Work
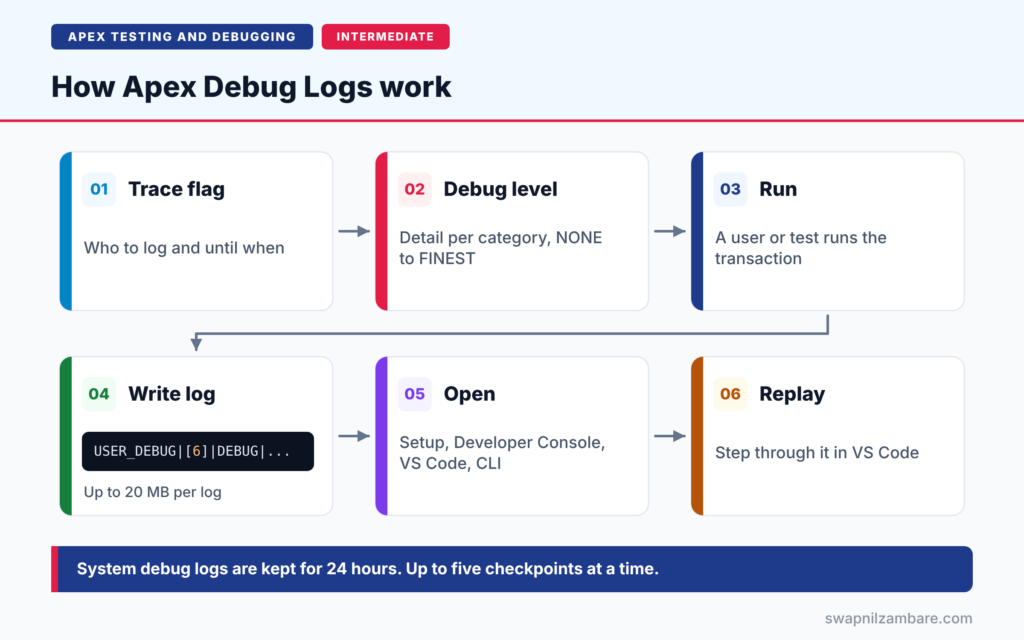
Apex Debug Logs follow a clear flow. First, you create a trace flag for a user, class or trigger, with a start time and an expiry time. Next, you pick a debug level, which sets the detail for each category. Then the user, or your test, runs the transaction. After that, Salesforce writes a log and lists it in Setup and the Developer Console. Finally, you open it, filter it, or replay it in VS Code.
Trace Flags
A trace flag says who or what to log and for how long. Create one in Setup > Debug Logs > New. The Developer Console and the CLI create one for you automatically when you work in them.
Debug Levels
A debug level sets a log level for each category, such as Apex Code, Database, Workflow, Validation, Callout and System. The levels go from NONE through ERROR, WARN, INFO, DEBUG and FINE up to FINEST.
Log Limits
Each log can be up to 20 MB, and Salesforce removes older lines from larger logs. System debug logs are kept for 24 hours. Also, if you generate more than 1,000 MB of logs in 15 minutes, Salesforce disables your trace flags for a while.
Checkpoints
A checkpoint is a marker on a line of Apex. When that line runs, Salesforce captures a heap dump, a snapshot of every variable. You can set up to five checkpoints at a time.
Apex Replay Debugger
The Replay Debugger is a free VS Code tool. It reads a log with Apex Code at FINEST and lets you step through the code, set breakpoints and inspect variables, as if the code were running live.
Useful Debug Log Events
The table below lists the log events you will read most often.
| Event | What it shows |
|---|---|
| CODE_UNIT_STARTED | A trigger, class or flow started |
| USER_DEBUG | Your System.debug message and line |
| SOQL_EXECUTE_BEGIN | A query and its text |
| DML_BEGIN | A DML operation and row count |
| EXCEPTION_THROWN | An exception and its message |
| FATAL_ERROR | An unhandled error that stopped the transaction |
| LIMIT_USAGE_FOR_NS | Limits used, such as queries and CPU time |
Developer Console vs Apex Replay Debugger
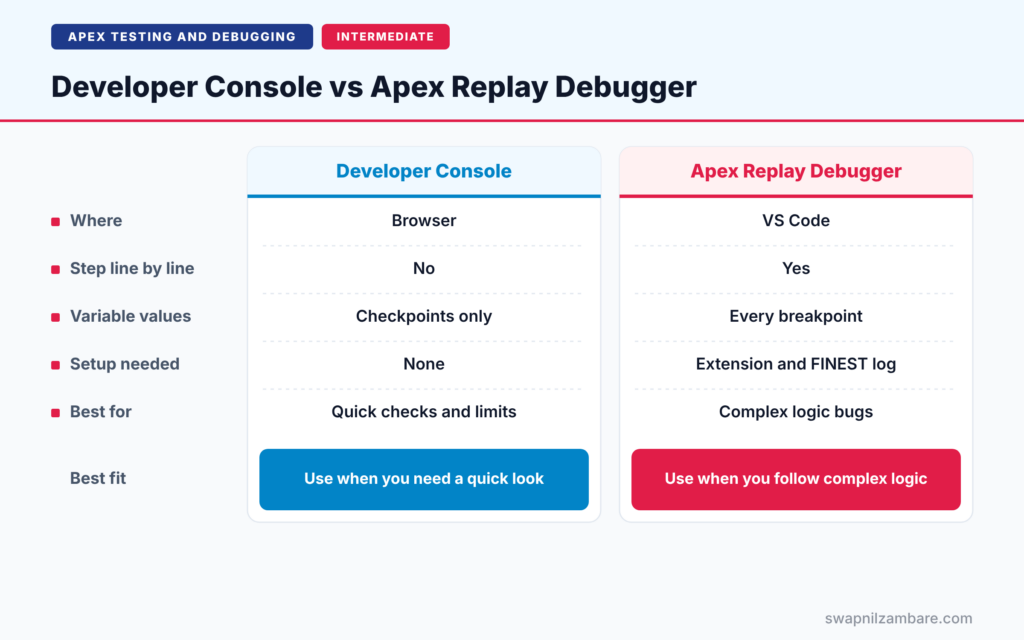
The table below compares the two main ways to read logs.
| Feature | Developer Console Log Inspector | Apex Replay Debugger |
|---|---|---|
| Where | Browser | VS Code |
| Step line by line | No | Yes |
| Variable values | Checkpoints only | Every breakpoint |
| Setup needed | None | Extension and FINEST log |
| Best for | Quick checks and limits | Complex logic bugs |
When to use which is simple. Use the Developer Console for a quick look at queries, limits and debug lines. Use the Replay Debugger when you need to follow values through many lines and methods.
A Real Apex Debug Logs Example
Let’s use Apex Debug Logs to find a bug at Bright Path Tutors. A test says Amount_Due__c is 0 instead of 5,000 for a new enrolment.
Step 1: Add Debug Statements
public static void setAmountDue(List<Enrolment__c> rows) {
    Set<Id> courseIds = new Set<Id>();
    for (Enrolment__c e : rows) { courseIds.add(e.Course__c); }
    Map<Id, Course__c> courses = new Map<Id, Course__c>(
        [SELECT Id, Fee__c FROM Course__c WHERE Id IN :courseIds]);
    System.debug(LoggingLevel.DEBUG, 'Courses found: ' + courses.size());
    for (Enrolment__c e : rows) {
        Course__c c = courses.get(e.Course__c);
        System.debug(LoggingLevel.DEBUG, 'Course ' + e.Course__c + ' fee: '
            + (c == null ? null : c.Fee__c));
        if (c != null) { e.Amount_Due__c = c.Fee__c; }
    }
}
The two debug lines print how many courses the query found and the fee for each enrolment. Use them while you investigate, then remove noisy ones.
Step 2: Watch Logs from the CLI
sf apex tail log --colorThis command streams new logs from your default org into the terminal and sets a trace flag for your user. Then run the failing test in another terminal. You can also download the latest log with sf apex get log –number 1.
Step 3: Read the Log
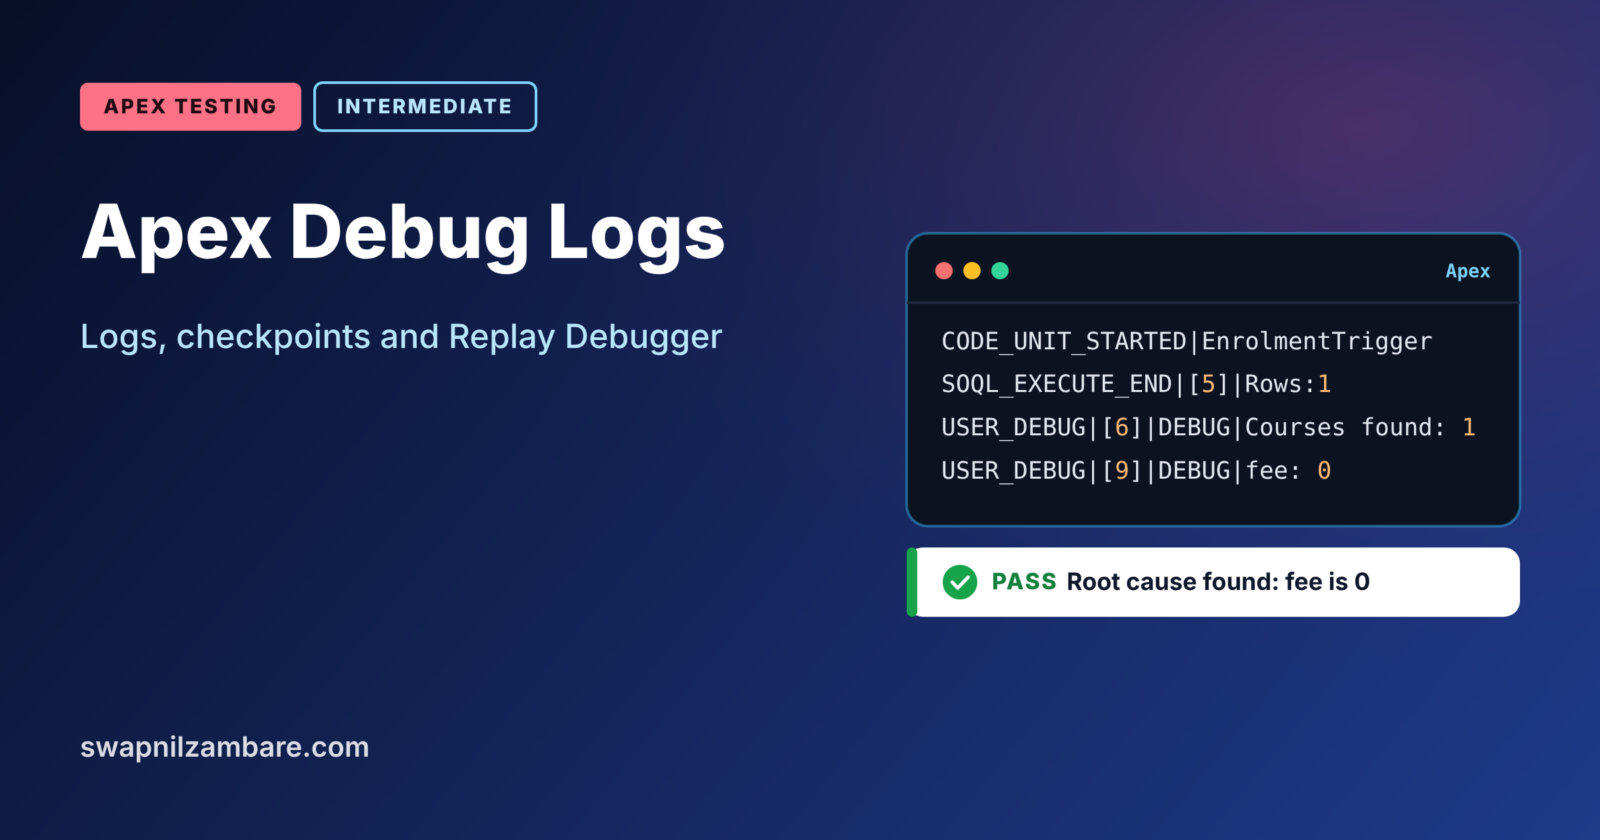
Here is a shortened, simplified part of the log.
CODE_UNIT_STARTED|EnrolmentTrigger on Enrolment trigger event BeforeInsert
SOQL_EXECUTE_BEGIN|[5]|SELECT Id, Fee__c FROM Course__c WHERE Id IN :tmpVar1
SOQL_EXECUTE_END|[5]|Rows:1
USER_DEBUG|[6]|DEBUG|Courses found: 1
USER_DEBUG|[9]|DEBUG|Course a015g00000XyZ12AAB fee: 0
The query found the course, but its fee is 0. So the bug is in the test data, not the trigger. The test factory created the course with Fee__c set to 0.
Step 4: Replay the Log in VS Code
In VS Code, open the Command Palette and run SFDX: Turn On Apex Debug Log for Replay Debugger. Then run the test again and get the log with SFDX: Get Apex Debug Logs. Next, set a breakpoint in setAmountDue, right-click the log file, and choose SFDX: Launch Apex Replay Debugger with Current File. You can now step through each line and watch c.Fee__c in the Variables panel.
Apex Debug Logs and Checkpoints
In the Developer Console, click in the left margin of a line to set a checkpoint, then run your code. The Checkpoints tab shows the heap dump for that line. In VS Code, use SFDX: Toggle Checkpoint on a line, then SFDX: Update Checkpoints in Org. Checkpoints show the state of objects that are not visible in normal debug lines.
Common Mistakes with Apex Debug Logs
- Logging everything at FINEST, which hits the 20 MB size limit and cuts off the log.
- Forgetting that the trace flag expired, then wondering why no log appears.
- Logging as yourself when the bug only happens for another user.
- Leaving many System.debug lines in production code.
- Reading only the last lines instead of searching for EXCEPTION_THROWN.
Best Practices for Apex Debug Logs
- Use a custom debug level with high detail only where you need it.
- Search logs for FATAL_ERROR, EXCEPTION_THROWN and USER_DEBUG first.
- Check LIMIT_USAGE_FOR_NS lines when you suspect limit problems.
- Use the Replay Debugger for logic bugs across many methods.
- Remove temporary debug lines once the bug is fixed.
Practice Task
Run sf apex run with a small Apex file that queries 3 courses and prints their fees with System.debug. Add –debug-level DETAIL, then open the log and find the SOQL_EXECUTE_BEGIN and USER_DEBUG lines. Hint: put the code in a file named debug.apex and pass it with –file.
Most Asked Interview Questions on Apex Debug Logs
Debugging questions show how you solve real problems. Here are the 21 questions asked most about Apex Debug Logs.
Basic Questions on Apex Debug Logs
Q1: What is a debug log?
A record of database operations, system processes and errors that happen during a transaction.
Q2: What is a trace flag?
A setting that tells Salesforce to log a user, class or trigger for a set time, at a chosen debug level.
Q3: What is a debug level?
A set of log levels for each category, such as Apex Code, Database and Workflow.
Q4: What are the log levels from lowest to highest detail?
NONE, ERROR, WARN, INFO, DEBUG, FINE, FINER and FINEST.
Q5: Where can you view debug logs?
In Setup > Debug Logs, the Developer Console, VS Code and the Salesforce CLI.
Q6: What is the maximum size of one debug log?
20 MB. Salesforce removes older lines from larger logs.
Q7: How long are system debug logs kept?
24 hours.
Code and Scenario Questions on Apex Debug Logs
Q8: How do you print a value to the log?
Use System.debug, optionally with a LoggingLevel such as LoggingLevel.ERROR.
Q9: Why does my System.debug line not appear?
The trace flag may have expired, or the Apex Code level is lower than the message’s logging level.
Q10: How do you find the cause of an error in a log?
Search for EXCEPTION_THROWN and FATAL_ERROR, then read the lines just before them.
Q11: How do you see governor limit usage in a log?
Look for LIMIT_USAGE_FOR_NS lines, which list queries, DML, CPU time and heap used.
Q12: How do you debug as another user?
Create a trace flag for that user in Setup > Debug Logs, then ask them to repeat the action.
Q13: How do you stream logs in the terminal?
Use sf apex tail log.
Q14: How many checkpoints can you set?
Up to five at a time.
Advanced Questions on Apex Debug Logs
Q15: What is the Apex Replay Debugger?
A free VS Code tool that replays a debug log so you can step through code and inspect variables.
Q16: What log level does the Replay Debugger need?
Apex Code at FINEST. The Turn On Apex Debug Log for Replay Debugger command sets this for you.
Q17: What is a heap dump?
A snapshot of all objects and variables in memory at a checkpoint line.
Q18: How is the Replay Debugger different from the Apex Interactive Debugger?
The Replay Debugger replays a saved log and is free. The Interactive Debugger pauses live code in a sandbox and needs a paid licence.
Q19: Why do huge logs hurt debugging?
They get cut at 20 MB, so important lines may be lost. Use lower levels for categories you do not need.
Q20: What happens if you generate too many logs too fast?
If logs exceed 1,000 MB in 15 minutes, Salesforce disables trace flags for a while.
Q21: Should System.debug stay in production code?
Keep only useful, low-volume messages. Remove temporary ones, because they add noise and CPU time.
Official Resources
- Debug Log (Apex Developer Guide)
- Replay Debugger (Salesforce Extensions for VS Code)
- Find and Fix Bugs with Apex Replay Debugger (Trailhead)
Quick Recap
- Apex Debug Logs record queries, DML, debug lines, limits and errors.
- Trace flags choose who to log, and debug levels choose how much detail.
- Logs are capped at 20 MB and kept for 24 hours.
- Checkpoints capture heap dumps for up to five lines.
- The Replay Debugger steps through a FINEST log in VS Code.
What’s Next?
You have finished Level 5: Testing and Debugging. Coming soon: Level 6, starting with with sharing, without sharing and inherited sharing.