Pipeline Inspection gives sales managers one screen to review every open deal and see what changed. For example, it highlights a close date pushed by a month or an amount that dropped. So weekly pipeline meetings become shorter and more focused.
This post builds on opportunities and sales process and collaborative forecasting. We will set it up for the Bright Path Tutors school partnerships team.
What is Pipeline Inspection?
Pipeline Inspection is a Sales Cloud view of opportunities with summary metrics, change tracking and AI insights. It opens from the Opportunities tab. Managers and reps can filter, review and even edit deals in one place.
Think of it like a cricket scoreboard with replays. The scoreboard shows the score, and the replay shows what changed in the last over. Pipeline Inspection shows both for your deals.
Why Pipeline Inspection Matters
Before this feature, managers exported reports and compared them by hand. That took hours, and changes were easy to miss. Also, reps often moved close dates quietly.
So Pipeline Inspection makes changes visible. Managers ask better questions, and forecasts become more accurate.
How Pipeline Inspection Works
After an admin turns it on, users open the Opportunities tab and click Pipeline Inspection. Then they choose a period, such as This Quarter, and a filter, such as My Team’s Opportunities. The screen shows metrics at the top and a list of deals below.
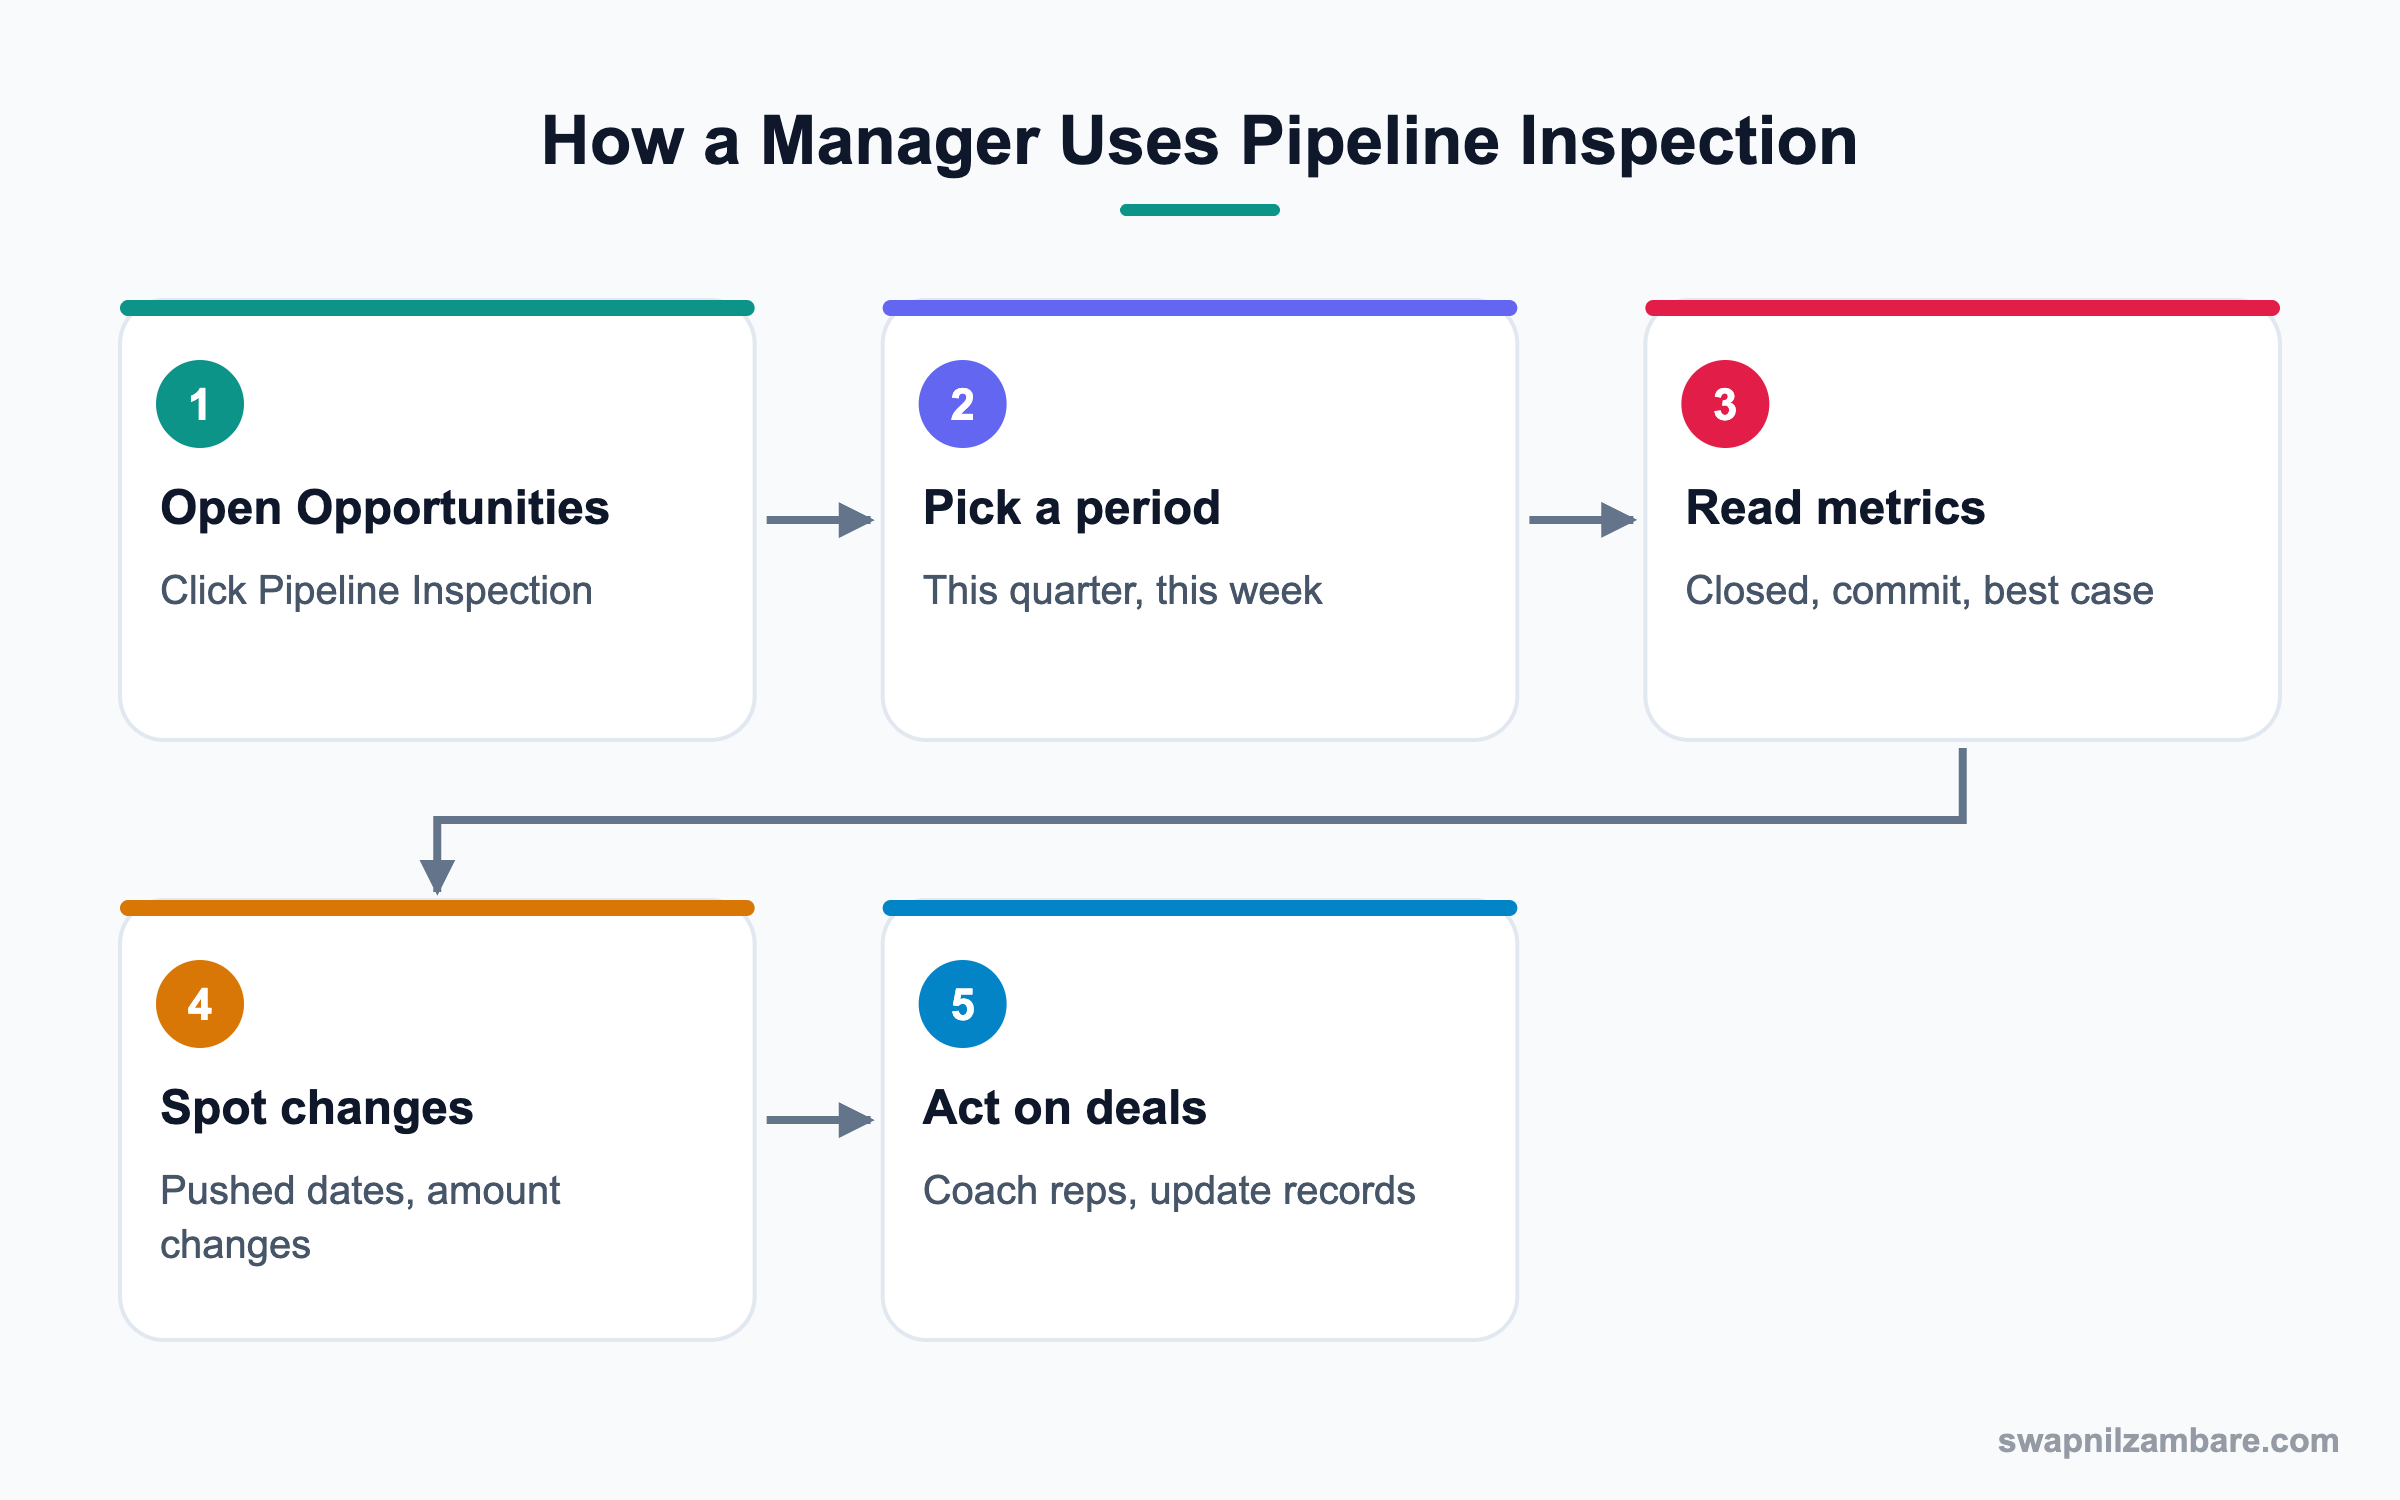
Metrics Bar
The top bar shows totals such as Closed Won, Commit, Best Case, Pipeline and Open. Clicking a metric filters the list.
Change Highlights
Changed fields are coloured. For example, a close date pushed out shows in red, and an increased amount shows in green. Hovering shows the old value.
Deal Insights and Scores
With Einstein features, the list shows opportunity scores and Deal Insights. For example, an insight may say a deal has had no activity for 30 days.
Waterfall Chart
The waterfall chart shows how the pipeline moved over the period. It shows new deals, moved-in, moved-out, won and lost amounts.
Inline Editing
Users can edit fields like Close Date, Stage and Next Step straight from the list. So updates happen during the meeting.
Key Pipeline Inspection Features
This table summarises the features and what each one tells you.
| Feature | What it shows | Example |
|---|---|---|
| Metrics bar | Totals by forecast category | Commit is 12 lakh |
| Change highlights | Field changes in the period | Close date pushed |
| Deal Insights | AI notes on deal risk | No activity in 30 days |
| Opportunity score | AI chance to win | Score 78 |
| Waterfall chart | How pipeline moved | 3 lakh moved out |
| Inline edit | Quick updates | New Next Step |
Pipeline Inspection vs Opportunity Reports
Both show deal data, but they serve different jobs. This table compares them.
| Feature | Pipeline Inspection | Opportunity reports |
|---|---|---|
| Purpose | Weekly deal review | Custom analysis |
| Change tracking | Built in | Needs history reports |
| Editing | Inline | Limited |
| AI insights | Available | Not by default |
| Customisation | Columns and filters | Fully custom |
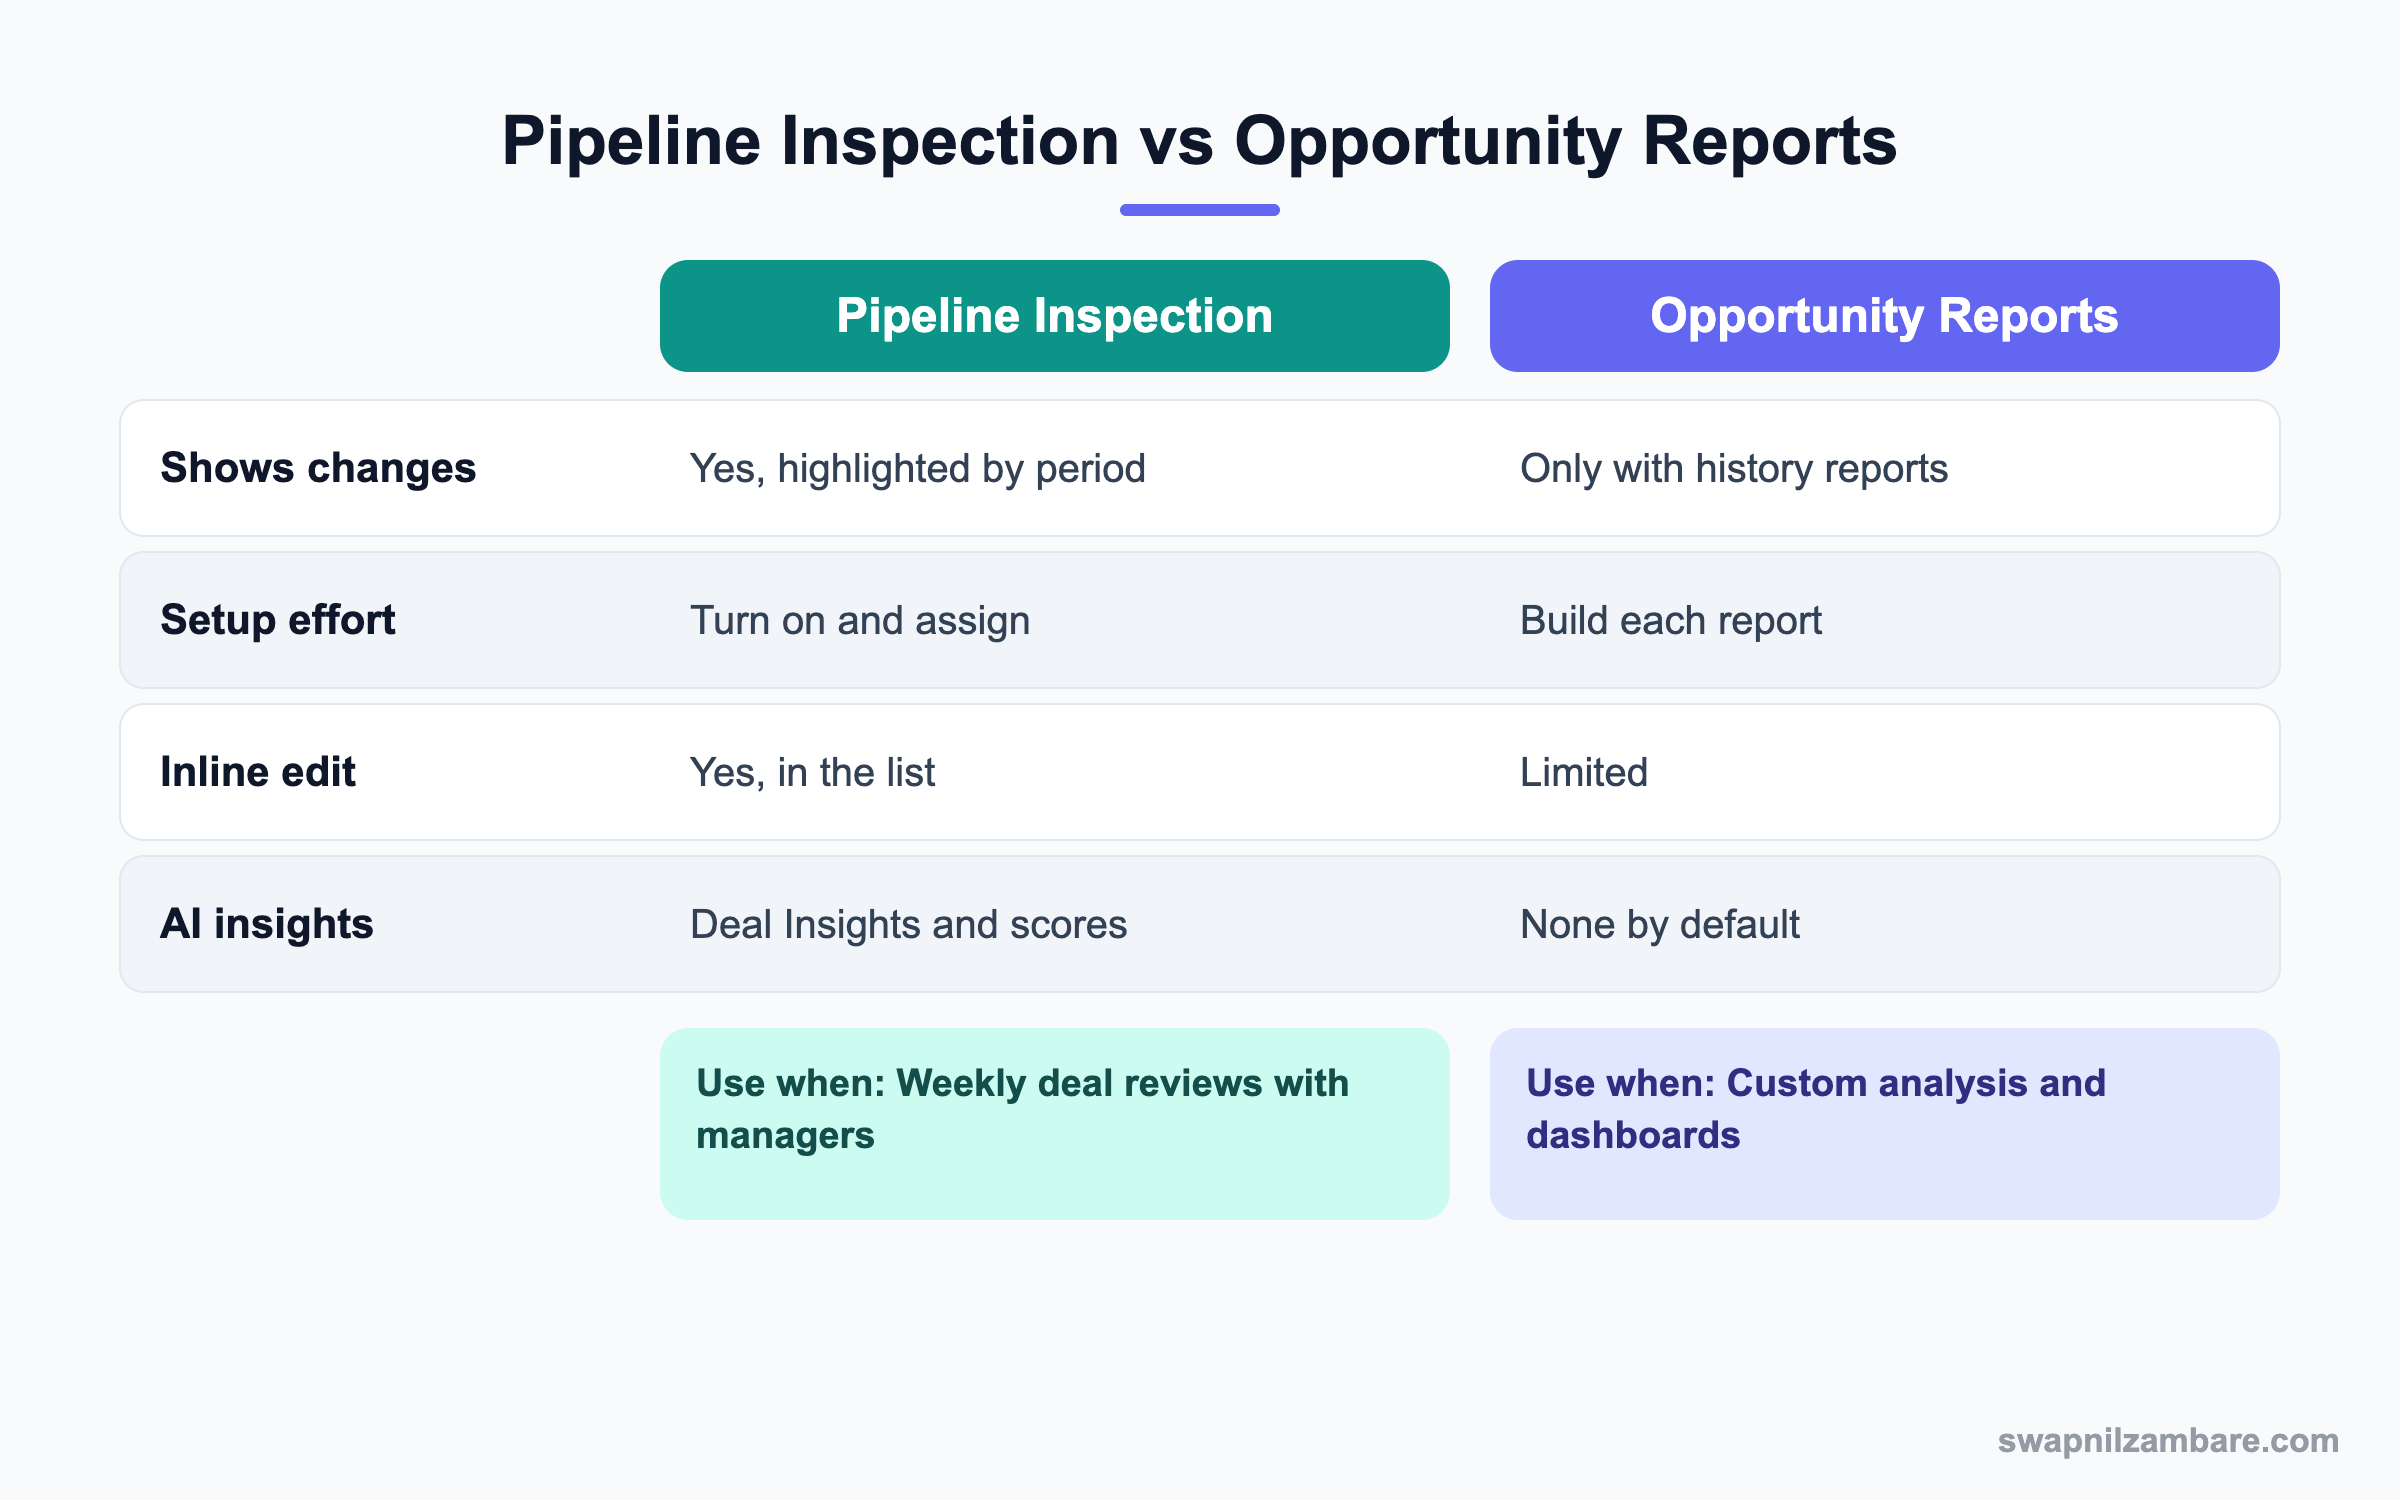
In short, use Pipeline Inspection for live deal reviews. Use reports and dashboards for deeper or historical analysis.
A Real Pipeline Inspection Example
The partnerships manager at Bright Path Tutors, Meera, holds a Monday deal review. She wants to see which school deals slipped last week.
Step 1: Turn It On
- Open Setup and type “Pipeline Inspection” in Quick Find.
- Turn on Pipeline Inspection.
- Assign access to sales users through their permission set or profile, as the setup page shows.
- Optionally, turn on Deal Insights and Opportunity Scoring if your license includes them.
Step 2: Choose Columns
- Open the Opportunities tab and click Pipeline Inspection.
- Click the gear icon on the list and choose columns.
- Add the columns from the table below.
| Column | Why it helps |
|---|---|
| Amount | Size of the deal |
| Close Date | Timing changes |
| Stage | Progress |
| Forecast Category | Commit or best case |
| Next Step | Planned action |
| Opportunity Score | AI win chance |
Step 3: Run the Monday Review
- Set the period to This Quarter and the filter to My Team’s Opportunities.
- Click Commit in the metrics bar.
- Sort by Close Date changes and hover over red values.
- Ask each rep about pushed deals and update Next Step inline.
Step 4: Check History with SOQL
For a deeper look, an admin can query field history on opportunities. This shows when close dates changed.
SELECT OpportunityId, Field, OldValue, NewValue, CreatedDate
FROM OpportunityFieldHistory
WHERE Field = 'CloseDate'
AND CreatedDate = LAST_N_DAYS:7
Common Mistakes with Pipeline Inspection
- Turning it on without training managers to use change highlights.
- Ignoring forecast categories, so metrics look wrong.
- Showing too many columns, which makes the list hard to read.
- Expecting AI insights without the needed license.
- Using it only once a quarter instead of every week.
Best Practices for Pipeline Inspection
- Use it in weekly one-to-one and team deal reviews.
- Keep a small set of columns that drive decisions.
- Map stages to forecast categories carefully.
- Ask reps to update Next Step during the review.
- Pair it with dashboards for long-term trends.
Practice Task
In your practice org, turn on Pipeline Inspection and change the close date of one opportunity. Then open the view and find the highlight. Hint: choose a period that includes today.
Most Asked Pipeline Inspection Interview Questions
These Pipeline Inspection questions come up in Sales Cloud interviews, especially for forecasting roles.
Basic Pipeline Inspection Interview Questions
Q1: What is Pipeline Inspection?
It is a Sales Cloud view that shows opportunities with metrics, change highlights and AI insights. Managers use it for deal reviews.
Q2: Where do users open it?
From the Opportunities tab, by clicking Pipeline Inspection.
Q3: What does the metrics bar show?
Totals such as Closed Won, Commit, Best Case, Pipeline and Open for the chosen period.
Q4: What do change highlights show?
They colour fields that changed in the period, like a pushed close date or a changed amount.
Q5: Can users edit opportunities in the view?
Yes. They can edit fields inline, such as Stage, Close Date and Next Step.
Q6: How do you turn it on?
In Setup, open Pipeline Inspection, turn it on and give users access.
Q7: What is a forecast category?
It groups opportunities by confidence, such as Pipeline, Best Case, Commit and Closed. Stages map to these categories.
Intermediate Pipeline Inspection Interview Questions
Q8: What are Deal Insights?
They are AI notes about deal health, like no recent activity or a likely close. They need Einstein features.
Q9: What is the waterfall chart?
It shows how the pipeline changed over a period, including new, moved, won and lost amounts.
Q10: How does it differ from reports?
The view focuses on live reviews with change tracking and inline edits. Reports are better for custom and historical analysis.
Q11: Why might metrics look wrong?
Stage to forecast category mapping may be wrong, or the filter and period may not match what the manager expects.
Q12: Can you customise columns?
Yes. Users can choose which columns to show in the list.
Q13: Does it need Collaborative Forecasts?
It uses forecast categories on opportunities. Forecasts help but are a separate feature with its own setup.
Q14: How does it help reps?
Reps see their own deals, risks and changes in one place. So they plan the week faster.
Advanced Pipeline Inspection Interview Questions
Q15: Scenario: a manager says deals slip every month. How can Pipeline Inspection help?
Filter for close dates pushed out and review them weekly. Then coach reps on qualification and set clear next steps.
Q16: How would you roll it out to a sales team?
Fix forecast category mapping, choose default columns and train managers. Then use it in every weekly review.
Q17: How do Opportunity Scores work?
Einstein scores each deal based on past wins and losses in your org. Higher scores mean a higher chance to win.
Q18: Scenario: AI insights do not appear. What do you check?
Check the license, whether Einstein features are on and whether there is enough historical data.
Q19: How would you report on slipped deals over a quarter?
Use opportunity history or field history reports. Then build a dashboard chart of pushed deals by rep.
Q20: How does it support accurate forecasts?
It makes risk and changes visible early. So managers adjust commit numbers with real evidence.
Q21: Who should use this view?
Sales managers use it most, but reps benefit too. So give access to both groups.
Q22: Can the view show custom fields?
Yes. You can add custom opportunity fields as columns. However, keep only the ones that help decisions.
Q23: How often should the team review deals this way?
Weekly works for most teams. Then the change period stays short and easy to discuss.
Q24: What happens to closed deals in the view?
Closed Won deals count in the metrics for the period. Closed Lost deals help explain movement in the waterfall chart.
Q25: Can you filter the deal list by territory?
Yes, list filters can use territory and owner fields. So territory managers see only their area.
Q26: Scenario: reps edit amounts just before the review. How do you spot it?
Change highlights show recent amount changes. Also, field history tracking on Amount keeps the record.
Q27: What is the difference between Commit and Best Case?
Commit holds deals the rep is confident will close. Best Case adds deals that could close if things go well. So Commit is the safer number.
Q28: Why should stages map carefully to forecast categories?
Because every metric depends on that mapping. For example, if Negotiation maps to Commit too early, the commit number looks too high.
Q29: How do you track activity on a deal?
Look at the activity timeline, last activity date and logged emails. Also, Einstein Activity Capture can fill gaps automatically.
Q30: What is a good Next Step value?
It is a short, dated action, like “Demo with principal on 12 Oct”. So anyone can see what happens next.
Q31: Scenario: a rep has many deals with no next step. What do you do?
Filter the list for blank Next Step and review them together. Then agree on a rule that every open deal needs one.
Q32: How do managers use the period filter?
They choose a period like this week or this quarter. Then the highlights show only changes inside that time.
Q33: What field history should you turn on for opportunities?
Track Amount, Close Date, Stage and Forecast Category. Then you can audit changes beyond the review screen.
Q34: How does a deal review differ from a forecast call?
A deal review checks individual deals and actions. A forecast call agrees on the team number, so both use the same data in different ways.
Official Resources
- Salesforce Help: Pipeline Inspection
- Trailhead: Pipeline Inspection
- Salesforce Help: Forecast Categories
Quick Recap
- Pipeline Inspection shows deals, metrics and changes on one screen.
- Change highlights reveal pushed dates and changed amounts.
- Deal Insights and scores add AI guidance with the right license.
- Inline editing lets teams update deals during reviews.
- Use reports and dashboards for deeper history.
What’s Next?
Next, we work with resellers through Partner Relationship Management.