CRM Analytics Basics start with one idea: bring data into fast datasets, then explore it in interactive dashboards. CRM Analytics can join Salesforce data with outside data, handle millions of rows and let users click through results. So it fills the gaps that standard reports cannot.
This post builds on reports and dashboards and Salesforce Report Charts. We will build a fee analysis app for Bright Path Tutors.
What are CRM Analytics Basics?
CRM Analytics is Salesforce’s advanced analytics platform, formerly called Tableau CRM and Einstein Analytics. Its basic building blocks are apps, datasets, recipes, lenses and dashboards. Users open it in Analytics Studio or see dashboards embedded on Lightning pages.
Think of reports as a calculator on your desk. CRM Analytics is a full spreadsheet lab, where you can combine sheets, clean them and build interactive charts.
Why CRM Analytics Basics Matter
Standard reports are great for daily work. However, they struggle with joining many objects, using outside data or showing trends across millions of rows. Leaders often ask questions that need all of these.
So CRM Analytics Basics help admins answer bigger questions. Also, templated apps like Sales Analytics give ready dashboards that teams can use quickly.
How CRM Analytics Works
In CRM Analytics Basics, data first syncs from Salesforce objects or external connectors. Then a recipe cleans, joins and transforms the data into a dataset. Finally, lenses and dashboards query the dataset and show results.
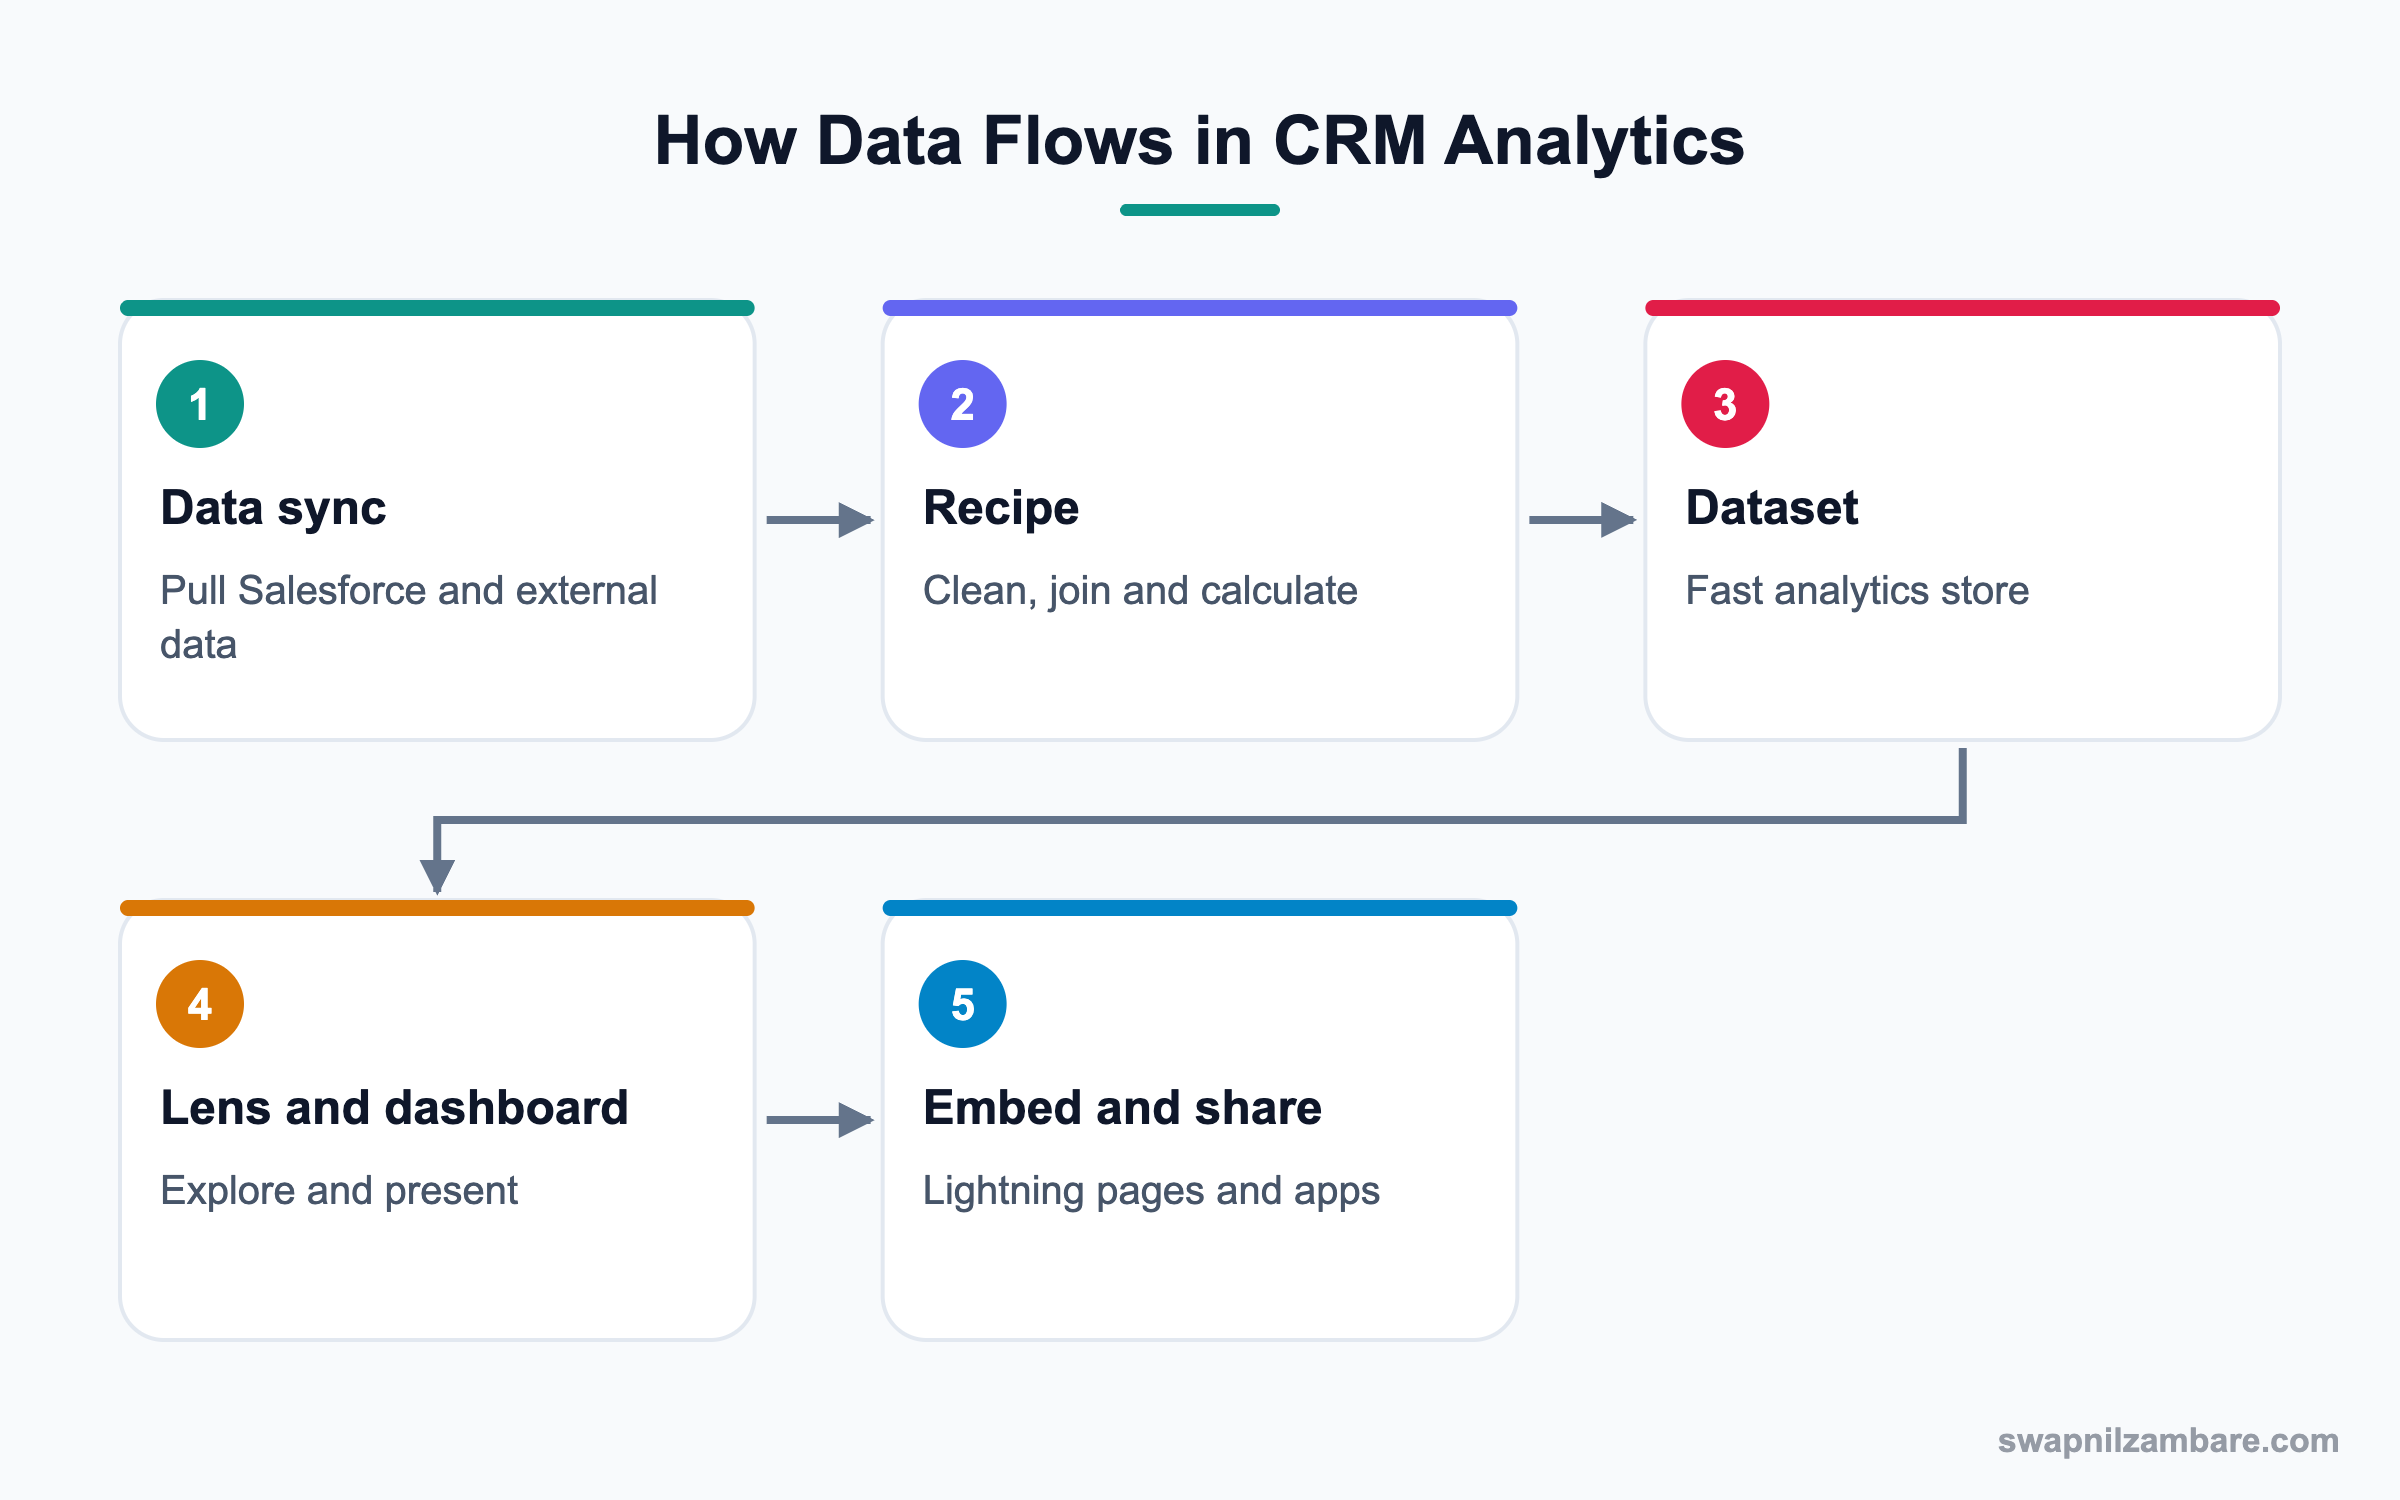
Apps
An app is a folder that holds dashboards, lenses and datasets. Sharing an app controls who can see its contents.
Data Sync and Connectors
Data sync copies Salesforce objects into CRM Analytics on a schedule. Connectors bring data from systems like Snowflake or other databases.
Recipes
A recipe is a visual data prep tool. You join, filter, add formulas and aggregate, then output a dataset.
Datasets
A dataset is a fast, compressed store built for analytics. Dashboards query datasets, not live records.
Lenses
A lens is a quick, single exploration of a dataset, like a pivot table. You can save it or turn it into a dashboard widget.
Dashboards
Dashboards combine charts, tables and filters. Users click a value and other charts filter, which is called faceting.
Security
Row-level security uses security predicates or sharing inheritance, so users only see rows they should.
CRM Analytics Basics Building Blocks
This table summarises the main parts.
| Part | What it does | Bright Path example |
|---|---|---|
| App | Holds and shares content | Fee Analytics app |
| Data sync | Copies Salesforce data | Enrolment and Payment objects |
| Recipe | Prepares data | Join enrolments with payments |
| Dataset | Fast data store | Fee_Analysis dataset |
| Lens | Quick exploration | Overdue by centre |
| Dashboard | Interactive view | Fee Health dashboard |
| Security predicate | Row-level access | Centre managers see own centre |
Salesforce Reports vs CRM Analytics
This table compares the two tools.
| Feature | Reports and dashboards | CRM Analytics |
|---|---|---|
| Data | Live records | Synced datasets |
| Sources | Salesforce only | Salesforce and external |
| Joins | Limited | Flexible |
| Volume | Good | Very large |
| License | Included | Extra license |
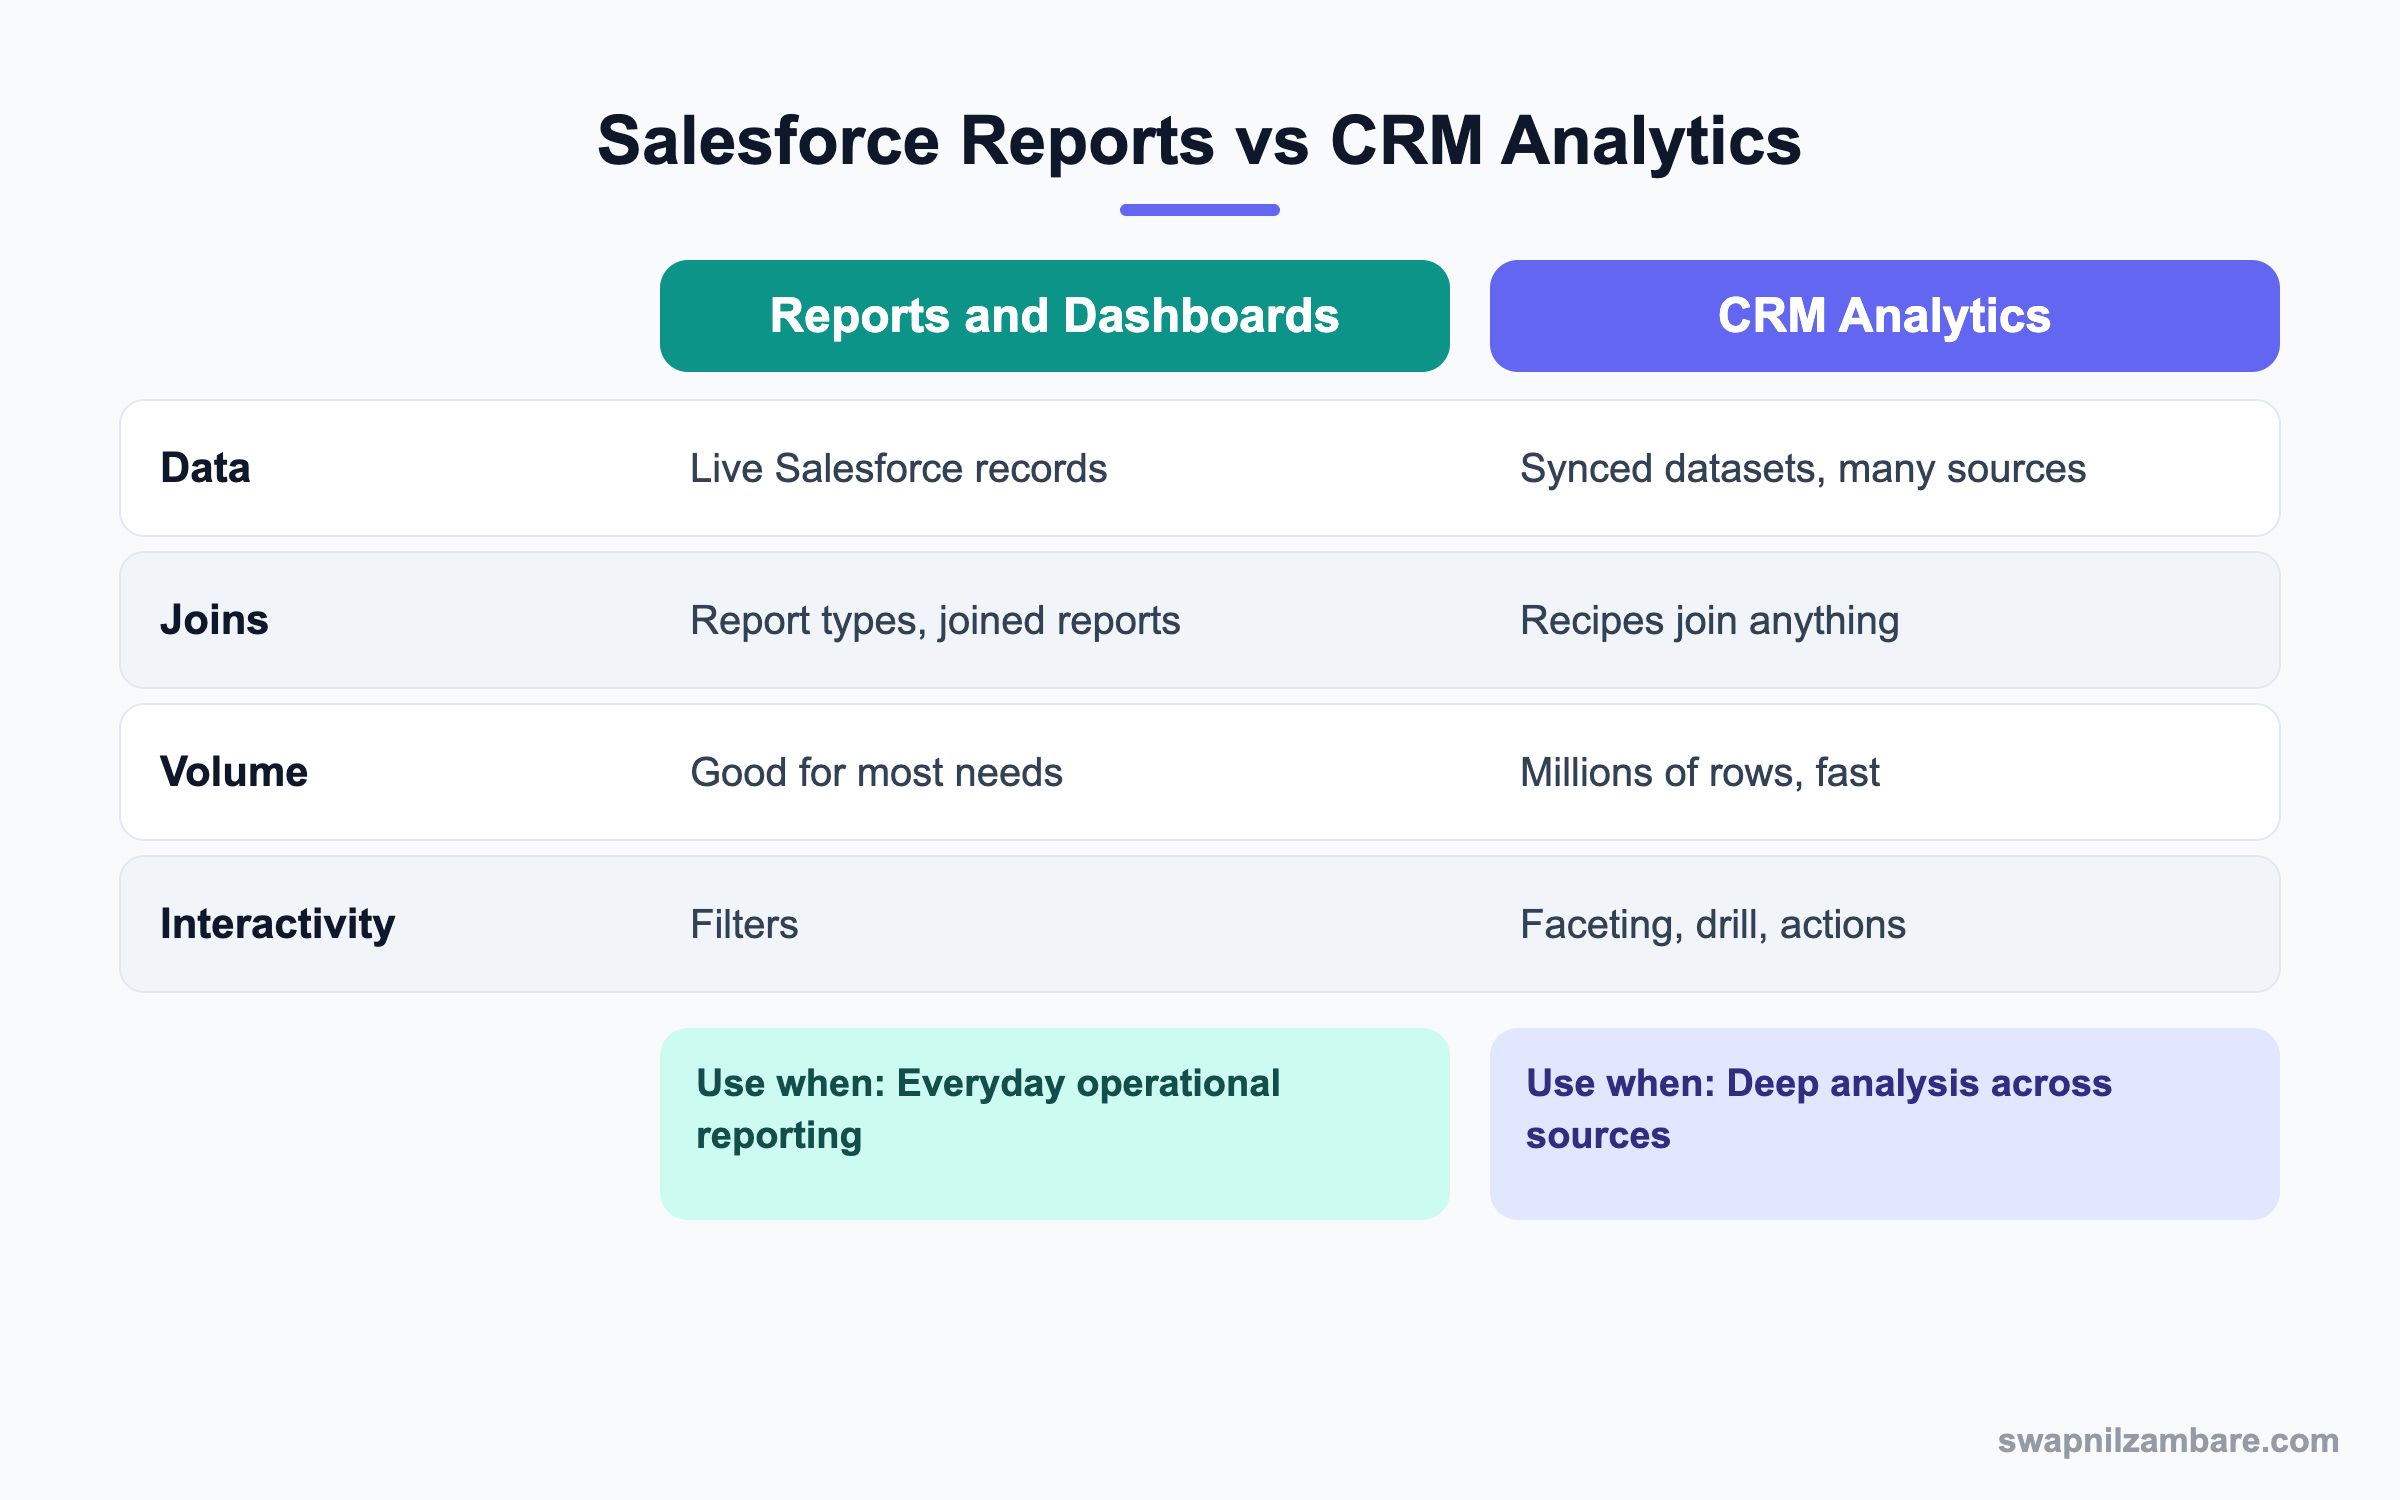
In short, keep reports for everyday operations. Use CRM Analytics when you need joins, outside data or deep analysis.
A Real CRM Analytics Basics Example
The finance head at Bright Path wants to see overdue fees by centre, course and month, joined with payment history from a separate payments system.
Step 1: Sync the Data
- Open Analytics Studio and go to Data Manager.
- Enable sync for Enrolment, Course and Account objects.
- Add a connector for the external payments database.
- Schedule the sync for every night.
Step 2: Build a Recipe
- Create a recipe called Fee Analysis Prep.
- Start with Enrolment and join Course and Account.
- Join the external payments table on Enrolment Number.
- Add a formula column Days Overdue and output the Fee_Analysis dataset.
These are the recipe outputs.
| Column | Source | Use |
|---|---|---|
| Centre Name | Account | Filter by centre |
| Course Name | Course | Group by course |
| Fee Amount | Enrolment | Totals |
| Amount Paid | Payments system | Compare |
| Days Overdue | Formula | Ageing buckets |
Step 3: Create the Dashboard
- Open the dataset and create a lens of overdue amount by centre.
- Save it into a new dashboard called Fee Health.
- Add a chart by course and a trend by month.
- Add filters for centre and course, then save to the Fee Analytics app.
Step 4: Secure and Share
Add a security predicate so each centre manager sees only their centre. A simple predicate looks like this.
'CentreOwnerId' == "$User.Id"Then share the app with the Finance and Centre Managers groups. Finally, embed the dashboard on the Account page with the CRM Analytics Dashboard component.
Common Mistakes with CRM Analytics Basics
- Expecting datasets to update instantly like live reports.
- Skipping row-level security on sensitive data.
- Building huge recipes that are hard to maintain.
- Creating dashboards nobody asked for.
- Forgetting license and permission set assignments.
Best Practices for CRM Analytics Basics
- Start with a clear business question.
- Keep recipes simple and well named.
- Add security predicates before sharing apps.
- Schedule syncs and recipes at quiet hours.
- Use templated apps when they fit your needs.
Practice Task
In a Developer Edition org with CRM Analytics, create a lens on the Opportunity dataset showing amount by stage. Then save it into a dashboard. Hint: data sync must include Opportunity first.
Most Asked CRM Analytics Basics Interview Questions
These CRM Analytics Basics questions appear in analytics and senior admin interviews.
Basic CRM Analytics Basics Interview Questions
Q1: What is CRM Analytics?
Among CRM Analytics Basics, the first answer is that it is Salesforce’s advanced analytics platform for interactive dashboards, large data and outside sources. It was called Tableau CRM and Einstein Analytics before.
Q2: What is a dataset?
A dataset is a fast, compressed data store that dashboards query. It is refreshed by syncs and recipes, not live.
Q3: What is a recipe?
A recipe is a visual tool to clean, join and transform data, then output a dataset.
Q4: What is a lens?
A lens is a single, quick exploration of a dataset. You can save it or add it to a dashboard.
Q5: What is an app in CRM Analytics?
An app is a folder for dashboards, lenses and datasets. Sharing the app controls access.
Q6: What is data sync?
It copies Salesforce object data into CRM Analytics on a schedule, so recipes can use it.
Q7: Do users need a license?
Yes. CRM Analytics needs an extra license, such as Growth or Plus. So check licenses before you promise dashboards to a team.
Intermediate CRM Analytics Basics Interview Questions
Q8: How is CRM Analytics different from reports?
It uses synced datasets, joins many sources and handles large volume with rich interaction. Reports use live Salesforce data with simpler joins.
Q9: What is faceting?
When a user clicks a value in one chart, other charts on the dashboard filter to match.
Q10: How do you secure rows in a dataset?
Use security predicates or sharing inheritance, so users see only rows they are allowed to.
Q11: What is SAQL?
SAQL is the query language for CRM Analytics. Admins mostly use the visual builder, but SAQL helps for complex queries.
Q12: How do you embed a dashboard in Salesforce?
Use the CRM Analytics Dashboard component in Lightning App Builder and set filters from the record.
Q13: What are templated apps?
Ready-made apps like Sales Analytics or Service Analytics. They create datasets and dashboards from a wizard.
Q14: How often is data refreshed?
As often as syncs and recipes are scheduled, for example nightly or hourly within limits.
Advanced CRM Analytics Basics Interview Questions
Q15: Scenario: a dashboard shows old numbers. What do you check?
Check the data sync and recipe run history in Data Manager. Then fix failures and rerun.
Q16: Scenario: a centre manager sees other centres. How do you fix it?
Add or correct the security predicate on the dataset. Then test as that user.
Q17: When would you choose CRM Analytics over Tableau?
When analysis lives inside Salesforce workflows and needs Salesforce security. Tableau suits wider, company-wide analytics.
Q18: How do you keep recipes maintainable?
Use clear node names, split complex logic and document each recipe’s purpose.
Q19: How can CRM Analytics drive action?
Dashboards can include actions to create tasks or update records. Also, Einstein Discovery adds predictions.
Q20: What is sharing inheritance?
It lets a dataset follow Salesforce sharing for certain objects, with a backup predicate when limits apply.
Q21: How do you handle large external data?
Use connectors with filters, sync only needed fields and aggregate early in recipes.
Q22: How do you measure dashboard adoption?
Use CRM Analytics usage data and ask users which views they open. Then remove unused dashboards.
Q23: Scenario: leaders want one KPI from three systems. How?
Bring all three through connectors, join them in a recipe and show the KPI in one dashboard.
Q24: Why plan the question before building?
Because CRM Analytics can do a lot. So a clear question keeps the build small and useful.
Q25: What should an admin learn first in CRM Analytics Basics?
Start with data sync, one simple recipe and one dashboard. Then add security predicates, because sharing data safely matters more than fancy charts.
Q26: Can CRM Analytics Basics skills help in interviews for admin roles?
Yes. Many senior admin roles mention CRM Analytics. So even one small project, like a fee dashboard, gives you real examples to discuss.
Q27: What is Einstein Discovery?
It is the predictive part of CRM Analytics. It finds patterns in data and can show predictions and improvement tips on records.
Q28: How do you deploy CRM Analytics assets?
Use change sets, DevOps Center or the Salesforce CLI with analytics metadata. However, test recipes and security in a sandbox first.
Q29: What happens when a recipe fails?
The dataset keeps the last good data, so dashboards show old numbers. Therefore set up notifications and check run history often.
Official Resources
Quick Recap
- CRM Analytics Basics cover apps, datasets, recipes, lenses and dashboards.
- Data syncs into datasets, which are fast but not live.
- Recipes join and clean data from many sources.
- Security predicates protect rows.
- Use reports for daily work and CRM Analytics for deep analysis.
What’s Next?
Next, we look at the newest analytics tool in Tableau Next Basics.